This course introduces you to the fundamental skills needed to use Wireshark effectively. It covers the most commonly used protocols and explores a variety of intriguing problems. To enhance your learning experience, the course incorporates practical exercises to share as much expertise as possible.
# 1 Introduction
1.1. What is Wireshark?
Wireshark is an application known as a "packet sniffer" and "protocol analyzer," designed to capture and analyze data on a network. It is a the successor of the once widely used Ethereal. The functionality of Wireshark is somewhat similar to the tcpdump (opens new window) tool, but it provides a GUI and additional functionality for sorting, filtering and visualising data.
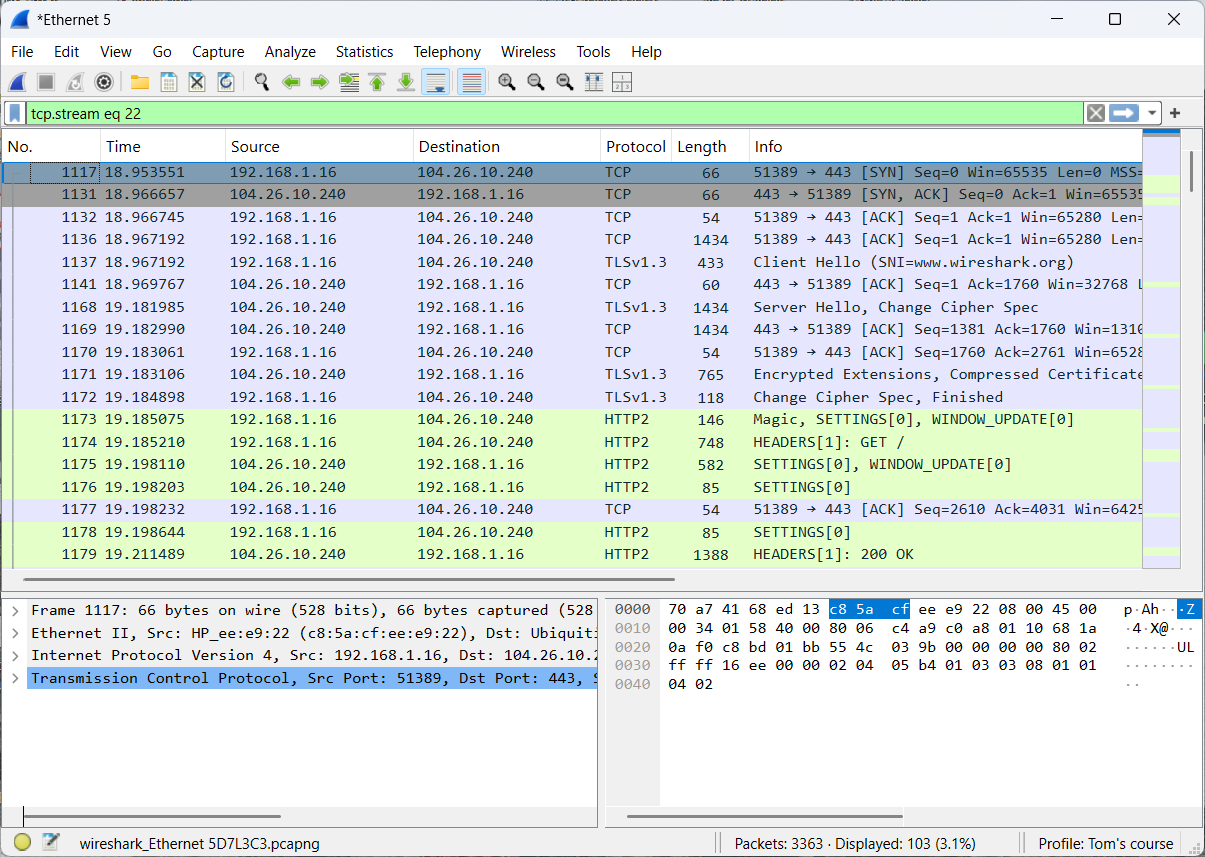
The figure below shows the main window of Wireshark with the differtent toolbars and panes.
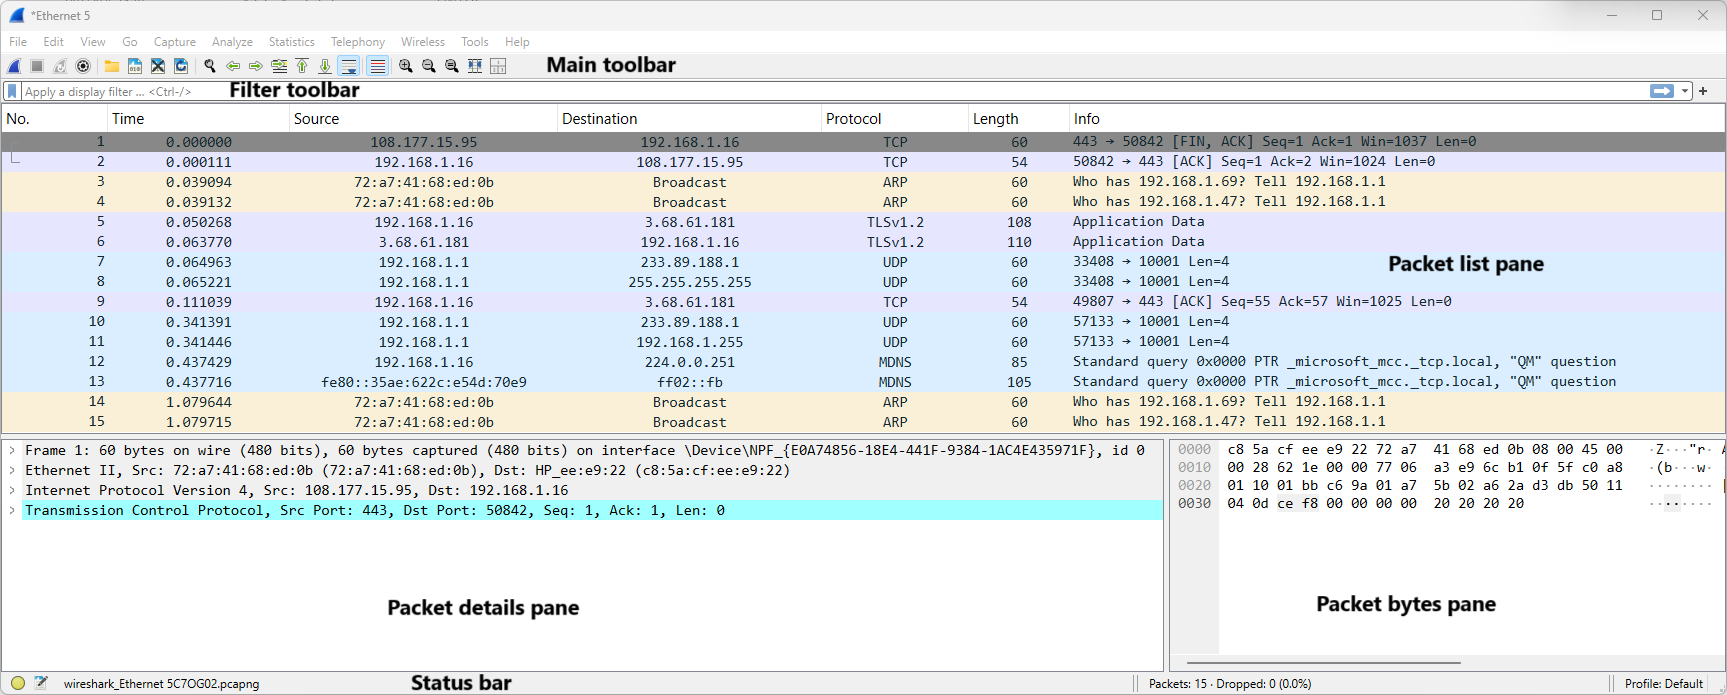
Wireshark enables users to monitor data transmitted over a network by setting the network card to promiscuous mode. This mode allows the network card to process all incoming frames, not just those specifically addressed to it.
Beyond merely displaying network traffic, Wireshark has the capability to interpret the structure of numerous network protocols. This enables the software to present the various nested protocols and reveal the contents of each field in detail.
Wireshark is available under an open-source license and is compatible with multiple platforms, including Windows, Unix, Unix-like systems such as Linux, and macOS. It utilizes Npcap/libpcap to capture network traffic.
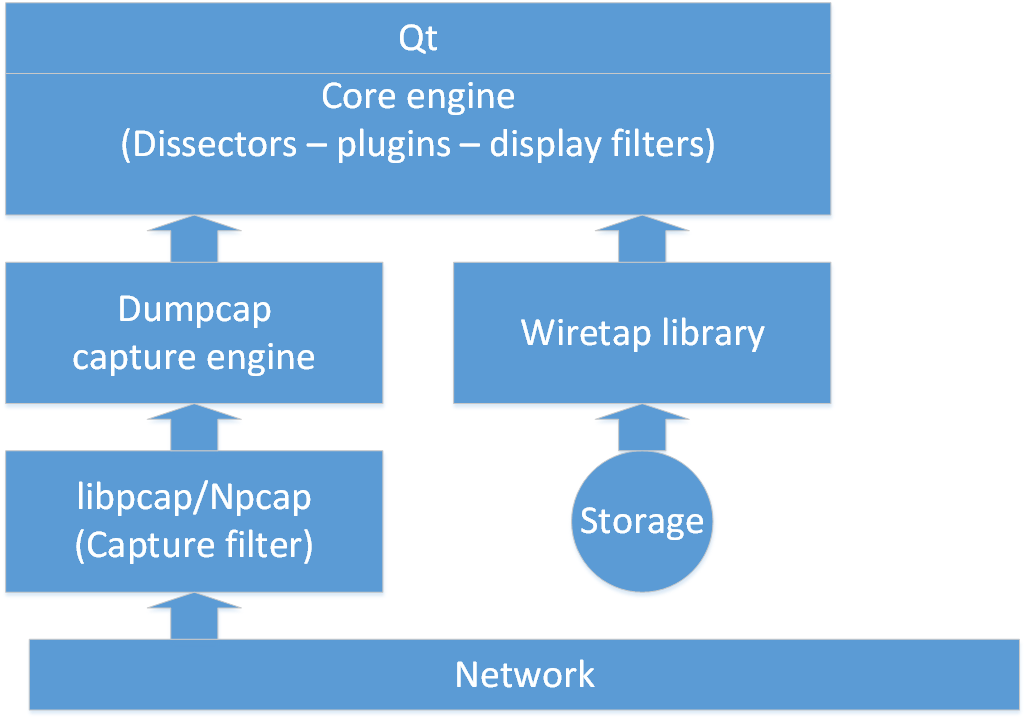
- Qt provides a platform independent graphical user interface for Wireshark.
- The Core engine supports thousands of dissectors and puts everything in a readable format.
- The Dumpcap capture engine determines how the capture process starts and stops.
- The libpcap/Npcap is a specific driver that takes the frames from the network and offers them to the Dumpcap capture engine.
- When you open a saved PCAPng file in Wireshark, you use the Wiretap library to offer the saved frames to the Core engine.
1.2. When to use Wireshark?
Wireshark provides visibility into the traffic's source, destination, and timing, but it doesn't explain the reasons behind the traffic. Therefore, it's essential to review the application and operating system logs and debug information.
Wireshark, on the other hand, can guide you on where to focus your investigation. For many "black box" network devices with limited or nonexistent user interface, Wireshark often becomes the primary troubleshooting tool.
Some of the most notable uses of Wireshark include:
- Network traffic analysis (e.g., identifying top talkers)
- Troubleshooting issues (e.g., diagnosing slow network performance)
- Security investigations (e.g., detecting suspicious hosts)
- Application analysis (e.g., bandwidth consumption)
1.3. First exploration
In this exercise, we will take a quick tour of the main window, along with the various toolbars and panes. The following file will be used: intro.pcapng (opens new window)
Questions:
- How many packets does this PCAPng file contain?
- What IP addresses made a TCP connection in frames 18, 21, and 22?
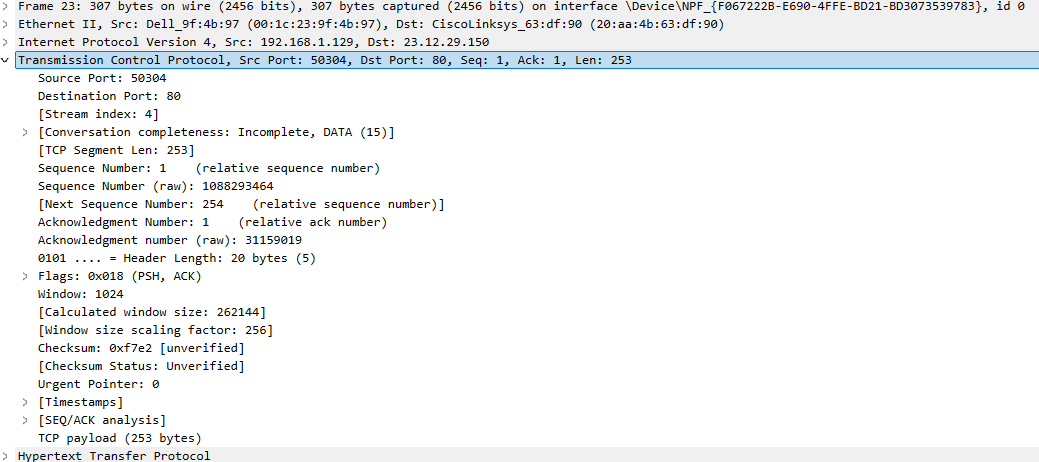
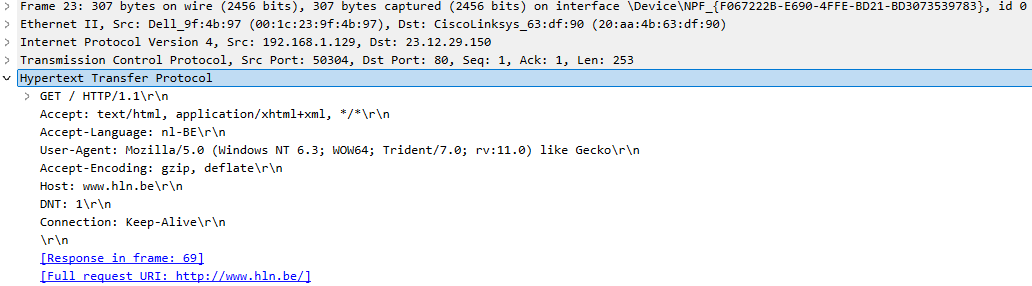
- What HTTP command was sent by the client in frame 23?
- What response was sent by the HTTP server in frame 29?
- What is the length of the largest frame in this PCAPng file?
- What protocols are visible in the protocol column?
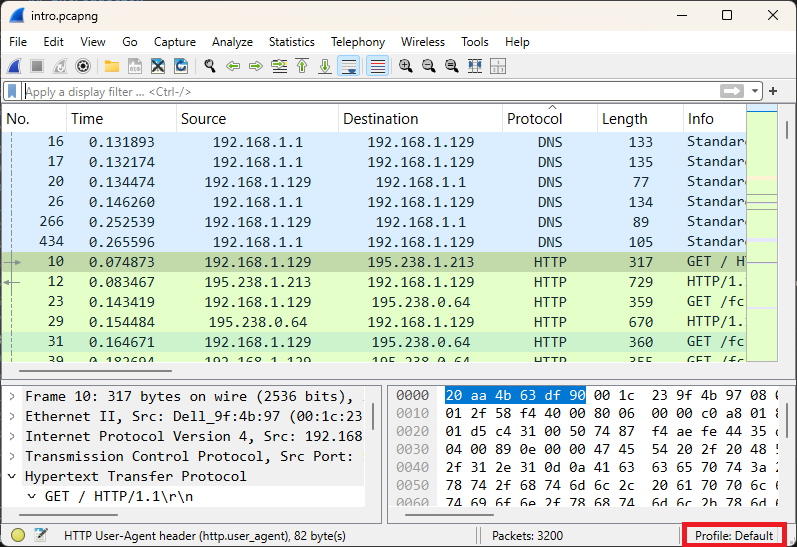
- What web browser was used by the client?
# 2 Getting Wireshark ready
2.1 Using configuration profiles
Configuration profiles enable you to customize settings based on your specific needs. For instance, you can set up separate profiles for troubleshooting and cybersecurity analysis.
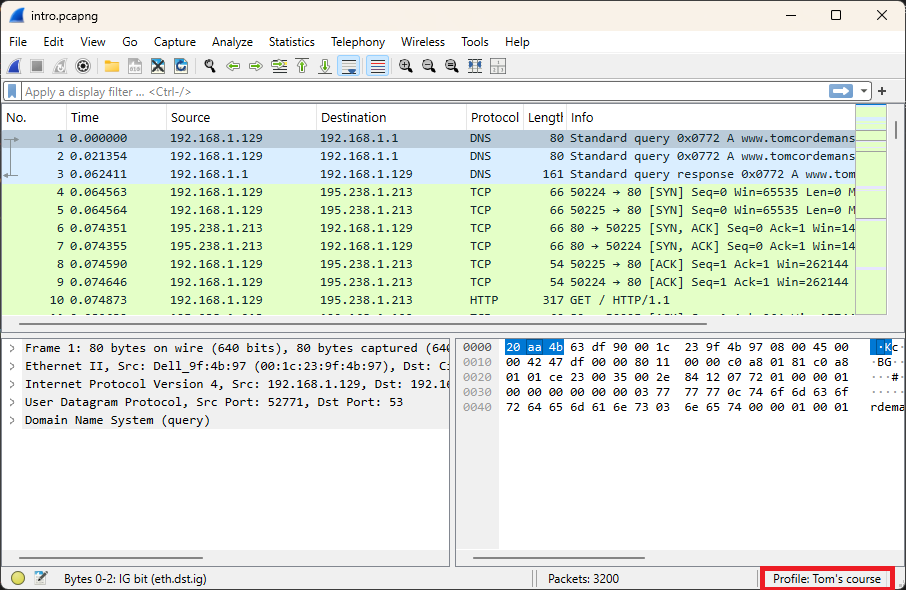
By default, Wireshark uses the default profile. It’s recommended to create a new profile promptly to preserve the default profile as a reference point for all future profiles.
A configuration profile is a folder containing text files that are loaded when the associated profile is activated. These files define preference settings, display filters, coloring rules, and more. Configuration profiles can be effortlessly shared using the import and export features. Profiles can be managed in various ways, such as through the menu by navigating to Edit > Configuration Profiles. Recent enhancements such as "Automatic Profile Switching" will be explored later in this course.
Tip: Create a new profile before continuing with this course.
2.2 Adding/removing columns
In this exercise, we will add an extra column.
The following file will be used: column.pcapng (opens new window)
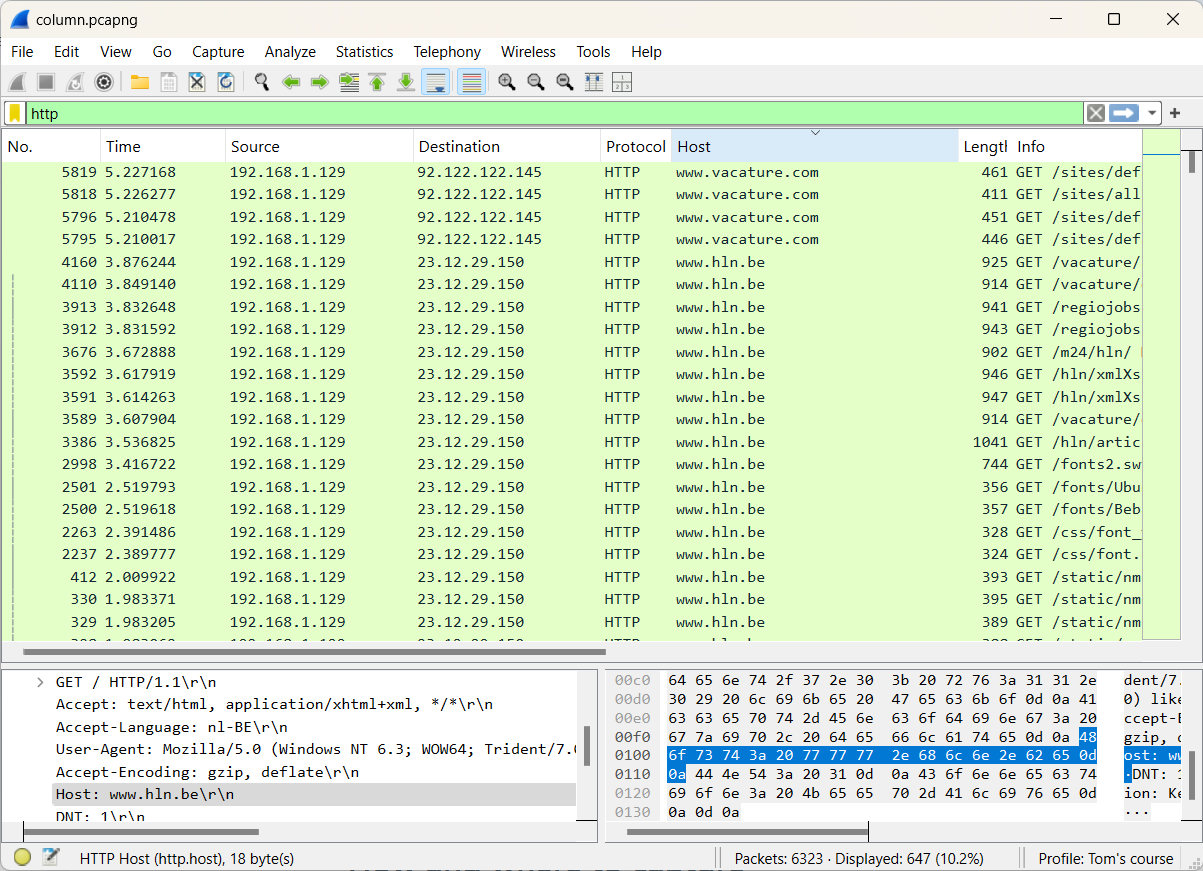
While browsing, an HTTP client makes multiple requests for HTTP objects to one or more HTTP servers. Our goal is to obtain an overview of all HTTP servers.
The following steps will be used:
- Step 1: Apply the display filter
httpin the filter toolbar. - Step 2: Look for a
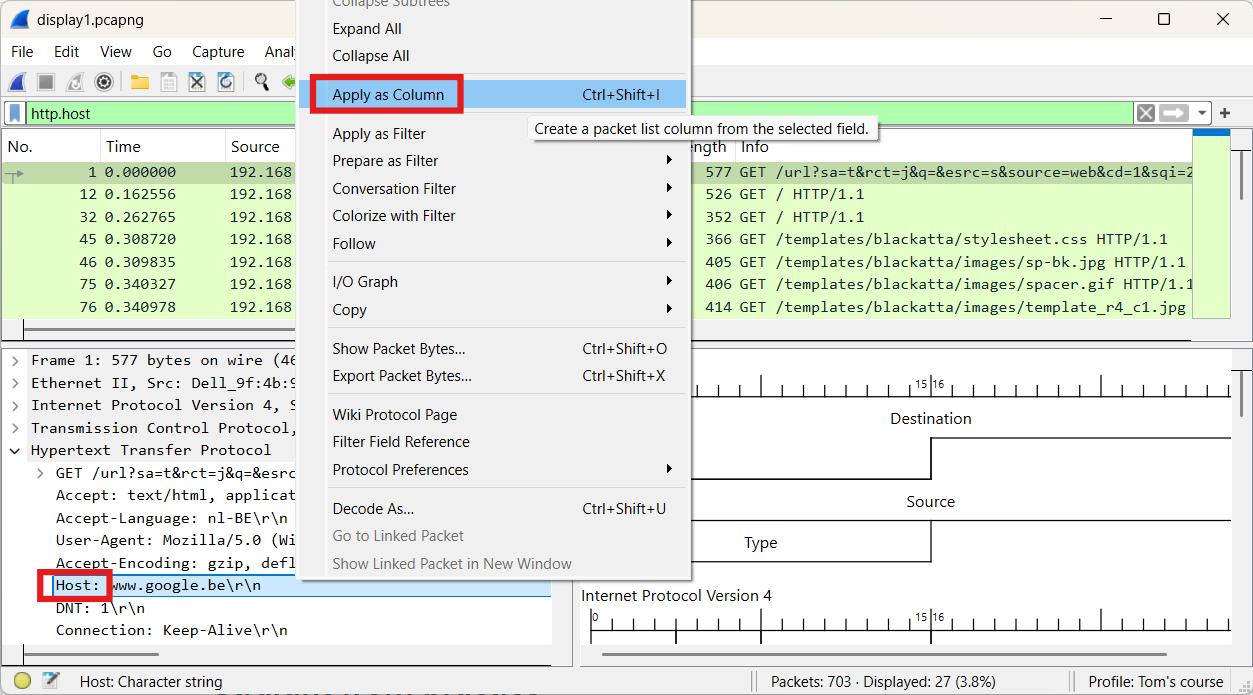
HTTP GETin the packet list pane. - Step 3: Look for the
Hostfield in the packet details pane. - Step 4: Right-click and select
Apply as Column.
The figure below shows an extra column that can be sorted.
2.3 Wireshark dissectors
Analyzing network traffic is one of Wireshark's most essential and powerful capabilities. The "dissection process" transforms raw data streams (bits) into readable requests, responses, refusals, retransmissions, and more. Wireshark's core engine recognizes the structure of thousands of protocols and applications.
For example, a computer on an LAN transmits an HTTP GET request to a website.
First, the frame dissector processes the data and makes the information accessible.
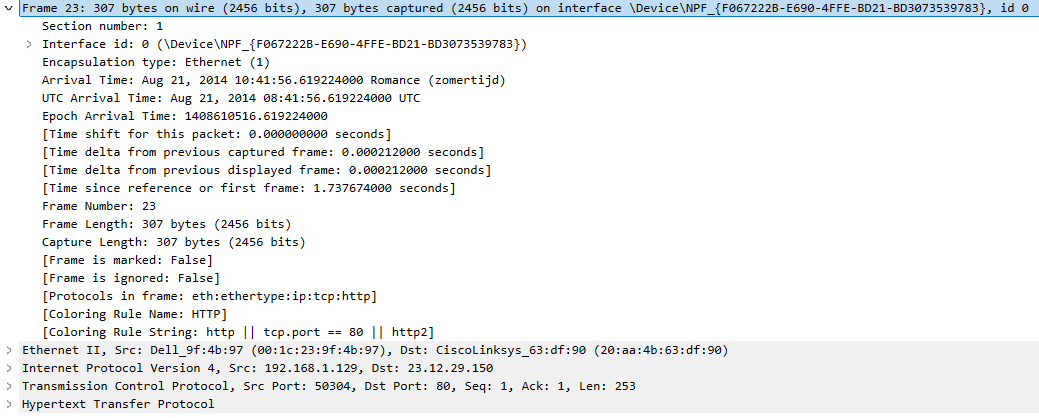
Next, the frame dissector passes the task to the Ethernet dissector, which interprets and presents the fields of the Ethernet header.
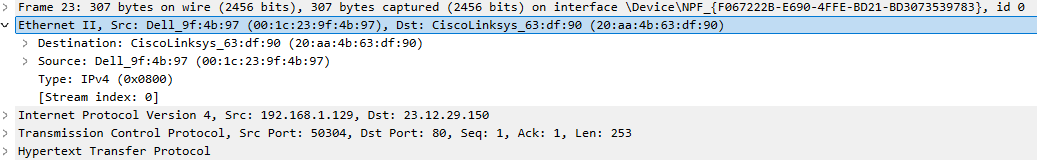
The next dissector is determined by the contents of the Type field. In this case, the Type field is 0x0800, indicating IPv4, so the IPv4 dissector is called next.
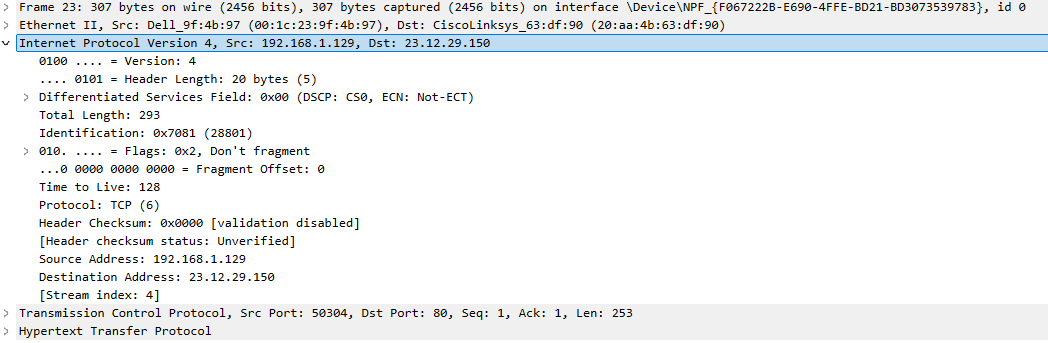
The IPv4 dissector interprets the IPv4 fields and examines the Protocol field to identify the next dissector. In this case, the TCP dissector takes over, processing the data and displaying the relevant information. The Port field then determines the subsequent dissector.
The HTTP dissector interprets and processes the different HTTP fields.
What happens if the dissectors fail to recognize the network traffic?
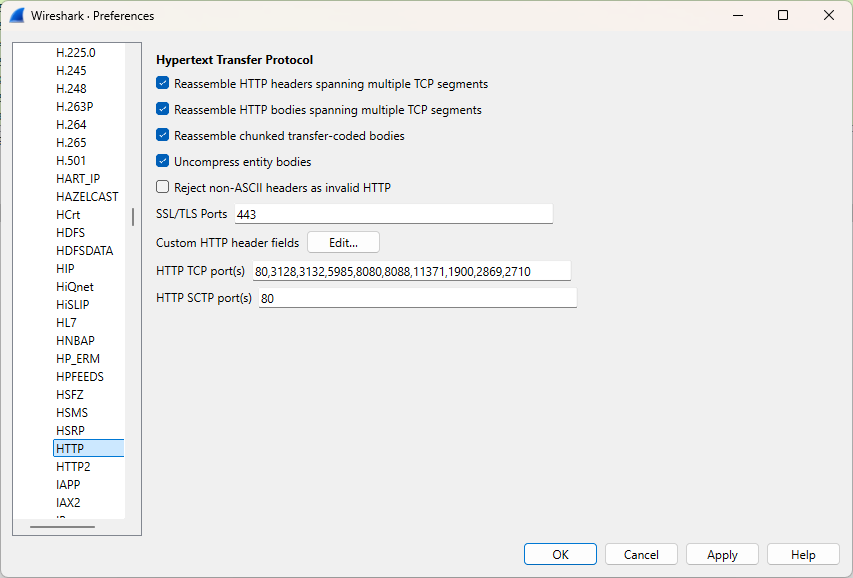
2.4 Network traffic through non-standardized ports
Network traffic that bypasses standard ports can be frustrating for a network administrator, as it often appears suspicious (e.g., an attempt to bypass firewall rules).
If you need to manually associate a port with a specific protocol, you can do so through Edit → Preferences → Protocols.
2.5 Hands-on exercise
To effectively troubleshoot with a network analyzer (such as Wireshark), a deep understanding of the OSI model and its associated protocols is essential. The following exercise will assess the students' knowledge and skills, allowing us to identify any necessary refresher training.
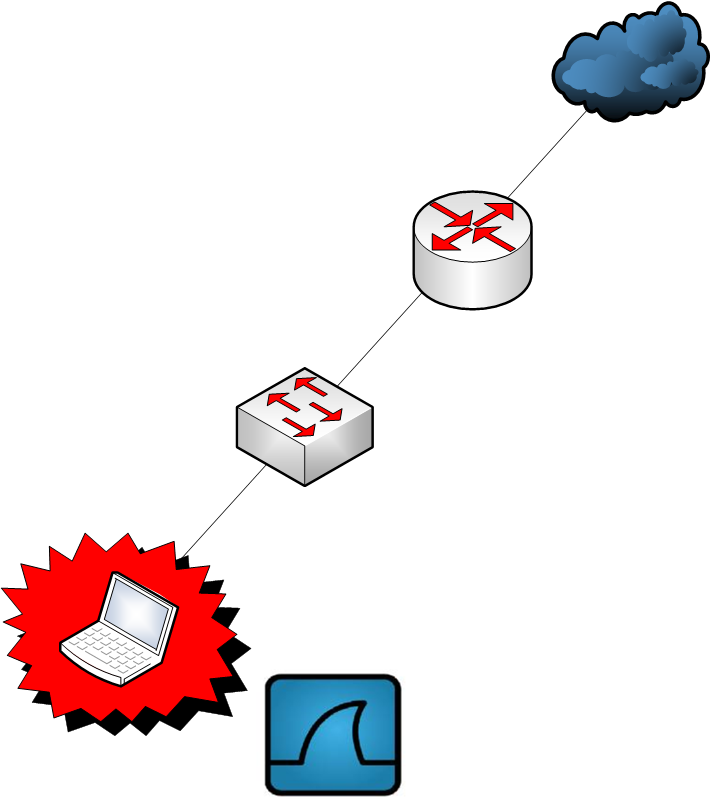
The figure below shows the used topology.
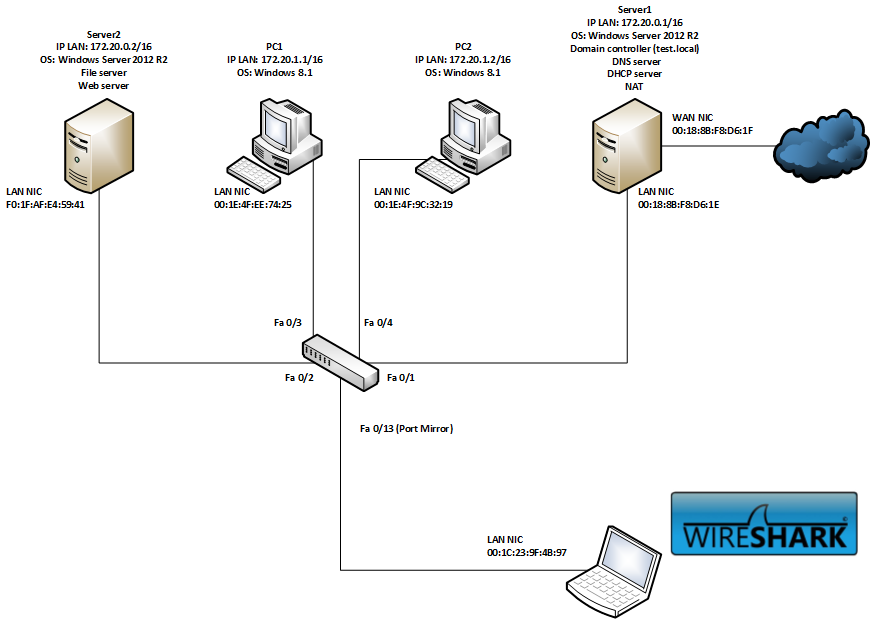
Problem Statement:
A user reports being unable to access the internal website (http://webserver.test.local), while external websites remain accessible. We have access to network traffic from PC1 through a port mirror and will analyze the provided capture file website.pcapng (opens new window).
Question:
Identify the most likely cause of the issue.
- A) IP conflict
- B) MAC spoofing
- C) Incorrect DNS configuration on Server1
- D) Server2 is completely unreachable
- E) The web server operates on a non-standard port
- F) Misconfigured proxy server on PC1
# 3 How and where to capture
Thorough preparation, including network documentation and troubleshooting procedures, is crucial!
When a problem arises, there won’t be time to analyze the network from scratch. Users expect swift and precise action.
3.1 Determine the optimal capture location
Aim to capture traffic as close as possible to the affected device. When a user reports an issue (e.g., slow downloads), it is best to analyze the problem from the user's perspective for the most accurate diagnosis.
3.2 Capturing options
There are three different ways to capture network traffic near the target device.
First option:
Install Wireshark directly on the host. Alternatively, you can use other tools like tcpdump.
Second option:
Most managed switches support port mirroring, allowing them to replicate all network traffic (excluding data link-layer errors) from a designated port to another port on the switch. This approach provides significant flexibility, with options like SPAN (Switch Port Analyzer), RSPAN (Remote SPAN), and ERSPAN (Encapsulated RSPAN).
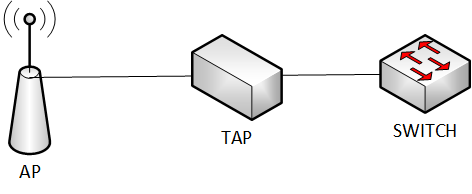
Third option:
A network tap is a full-duplex device placed between the target device and the switch, allowing it to forward all network traffic, including data link-layer errors. The main drawback of this option is its cost.
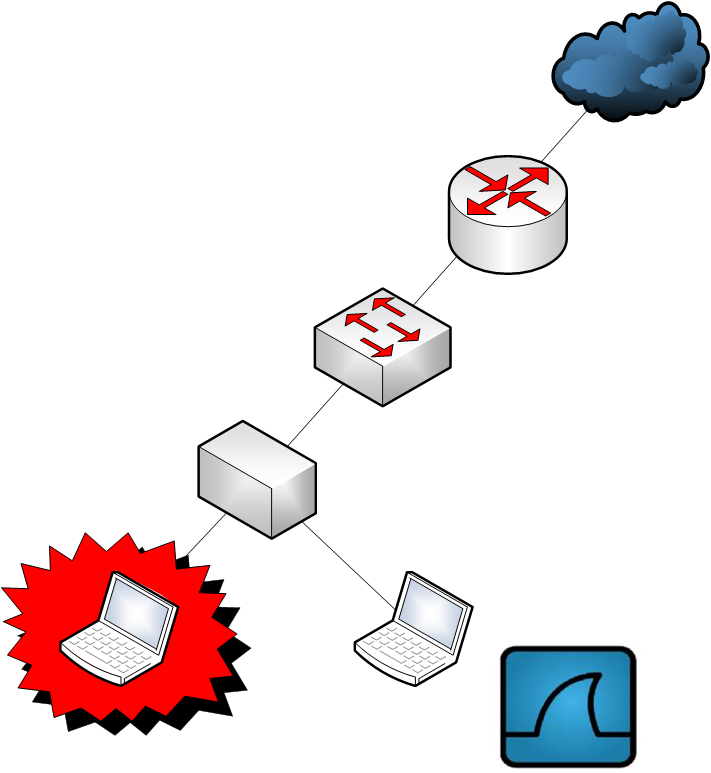
Inserting a hub between the target and the switch is not recommended, as it significantly alters the network and can lead to substantial performance degradation.
3.3 Capturing wireless networks. (WLAN)
Capturing wireless network traffic is significantly more complex. Therefore, we will dedicate a separate chapter to capturing, analyzing, and decrypting wireless networks.
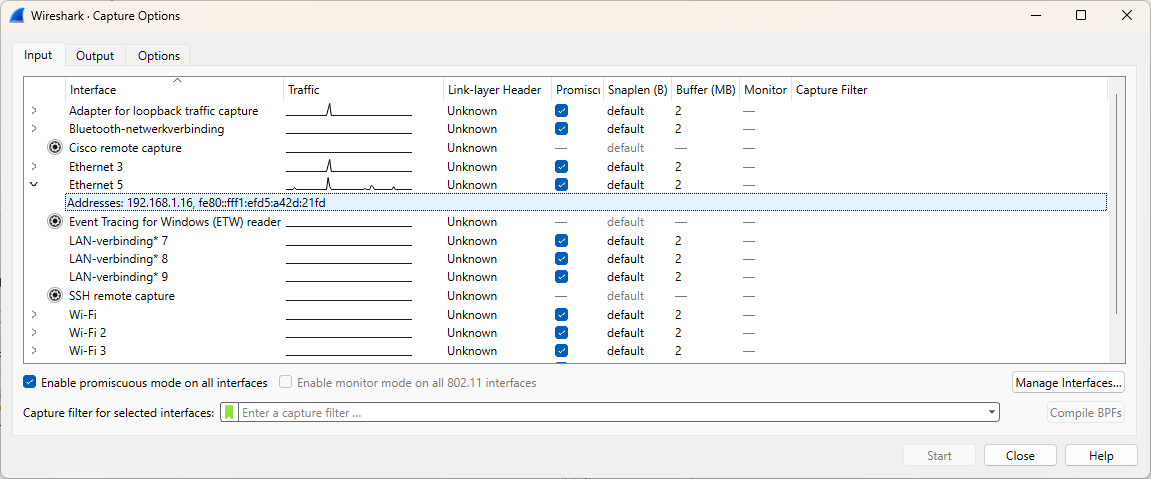
3.4 Active interfaces
If Wireshark does not detect the interface, it cannot be used within the application.
You can view your available interfaces by navigating to Capture → Options.
3.5 Capturing invisible
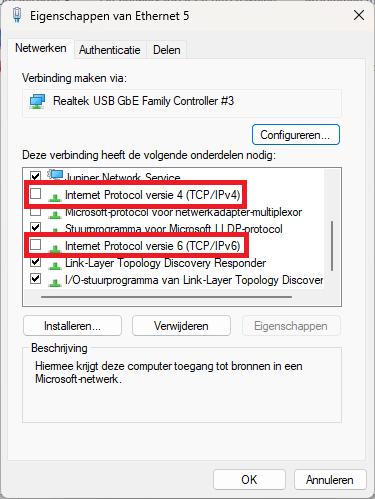
For accurate results, avoid making changes to the network configuration or keep them to a minimum. To make the computer running Wireshark invisible on the network, you can disable the TCP/IP stack.
Disabling the TCP/IP stack will ensure that Wireshark continues to function while the OS and other applications do not generate additional network traffic.
3.6 Managing large volumes of network traffic
Wireshark does not handle large capture files (PCAP or PCAPng) efficiently. To improve performance, you can use a File Set to split large files into smaller ones that Wireshark can process more quickly.
Recommended practice: Aim to keep your files under 100 MB whenever possible.
To clarify a few concepts, we will go through an exercise.
First, we launch Wireshark and navigate to Capture → Options.
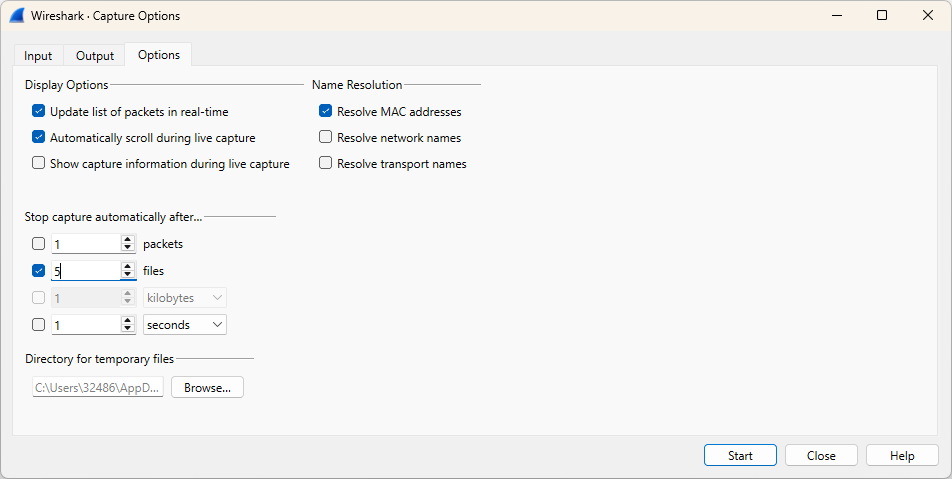
Our goal is to capture network traffic while splitting it into multiple files, each limited to 1MB or 10 seconds in duration, with the capture automatically stopping after five files.
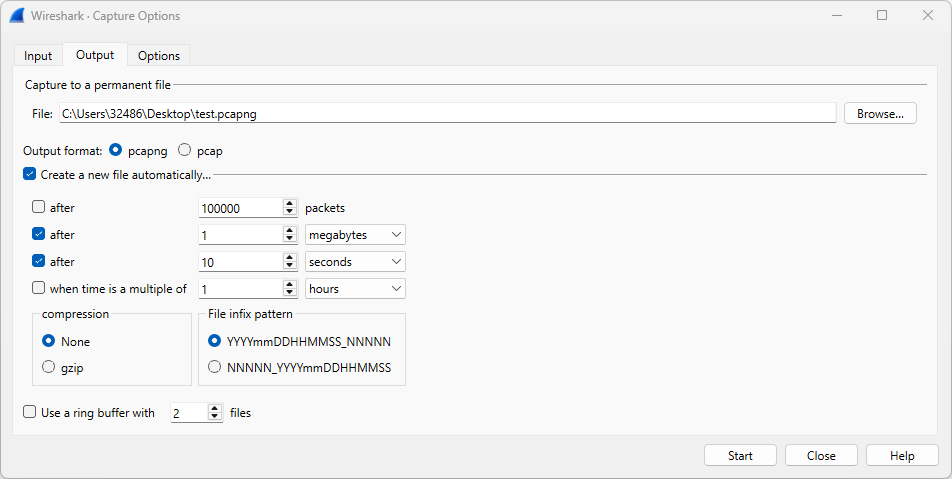
Now, click Start and browse the internet for a minute.
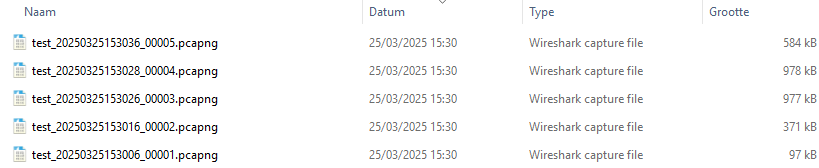
The image below displays the final result.
Imagine you need to capture network traffic continuously while storing up to five files, each covering a time span of one minute. Which option would you select? In what situations would this option be beneficial?
3.7 Using capture filters
If you plan to use Wireshark in a high-speed network environment, it may result in packet loss due to its limited processing speed. To manage this, capture filters can be applied to reduce the number of packets. However, be aware that using capture filters may inadvertently exclude relevant network traffic.
Under normal conditions, it's best to avoid using capture filters. Only use them if Wireshark struggles to process network traffic. You can check the status bar for dropped packets to identify any issues.

Capture filters utilize BPF (Berkeley Packet Filter) syntax. Here are some examples of BPF syntax:
| Syntax | Description |
|---|---|
| host 10.4.1.1 | Capture traffic to/from not host 10.4.1.1 |
| not host 10.4.1.1 | Capture all traffic except traffic to/from 10.4.1.1 |
| src host 10.4.1.1 | Capture traffic from 10.4.1.1 |
| dst host 10.4.1.1 | Capture traffic to 10.4.1.1 |
| host www.hln.be | Capture traffic to/from any IP address that resolves to www.hln.be |
| net 10.8.0.0/16 | Capture traffic to/from any host on network 10.8.0.0 |
| not dst net 10.8.0.0/16 | Capture all traffic except traffic to an IP address starting with 10.8 |
| dst net 10.8.0.0/16 | Capture traffic to any IP address starting with 10.8 |
| src net 10.8.0.0/16 | Capture traffic from any IP address starting with 10.8 |
| ip broadcast | Capture traffic to 255.255.255.255 |
| ip multicast | Capture traffic to 224.0.0.0 through 239.255.255.255 (also catches traffic to 255.255.255.255) |
| ether host 00:08:15:00:08:15 | Capture traffic to or from 00:08:15:00:08:15 |
| ether src 02:0A:42:23:41:AC | Capture traffic from 02:0A:42:23:41:AC |
| ether dst 02:0A:42:23:41:AC | Capture traffic to 02:0A:42:23:41:AC |
| not ether host 00:08:15:00:08:15 | Capture traffic to or from any MAC address except for traffic to or from 00:08:15:00:08:15 |
| port 53 | Capture UDP/TCP traffic to or from port 53 (typically DNS traffic) |
| not port 53 | Capture all UDP/TCP traffic except traffic to or from port 53 |
| port 80 | Capture UDP/TCP traffic to or from port 80 (typically HTTP traffic) |
| udp port 67 | Capture UDP traffic to or from port 67 (typically DHCP traffic) |
| tcp port 21 | Capture TCP traffic to or from port 21 (typically the FTP command channel) |
| portrange 1‐80 | Capture UDP/TCP traffic to or from ports from 1 through 80 |
| tcp portrange 1‐80 | Capture TCP traffic to or from ports from 1 through 80 |
| port 20 or port 21 | Capture all UDP/TCP traffic to or from port 20 or port 21(typically FTP data and command ports) |
| host 10.3.1.1 and port 80 | Capture UDP/TCP traffic to or from port 80 that is being sent to or from 10.3.1.1 |
| host 10.3.1.1 and not port 80 | Capture UDP/TCP traffic to or from 10.3.1.1 except traffic to or from port 80 |
| udp src port 68 and udp dst port 67 | Capture all UDP traffic from port 68 to port 67 (typically traffic sent from a DHCP client to DHCP server) |
| udp src port 67 and udp dst port 68 | Capture all UDP traffic from port 67 to port 68 (typically traffic sent from a DHCP server to a DHCP client) |
| icmp | Capture all ICMP packets |
| icmp[0]=8 | Capture all ICMP Type 8 (Echo Request) packets |
| icmp[0]=17 | Capture all ICMP Type 17 (Address Mask Request) packets |
| icmp[0]=8 or icmp[0]=0 | Capture all ICMP Type 8 (Echo Request) packets or ICMP Type 0 (Echo Reply) packets |
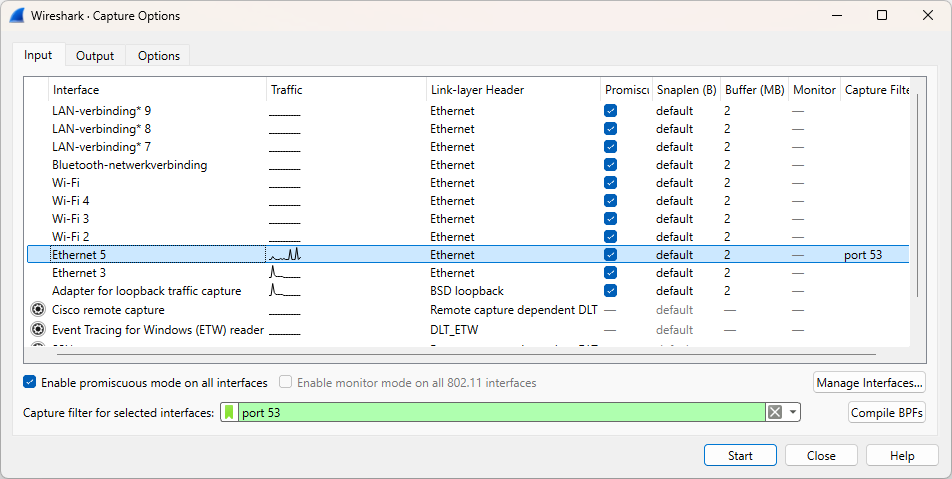
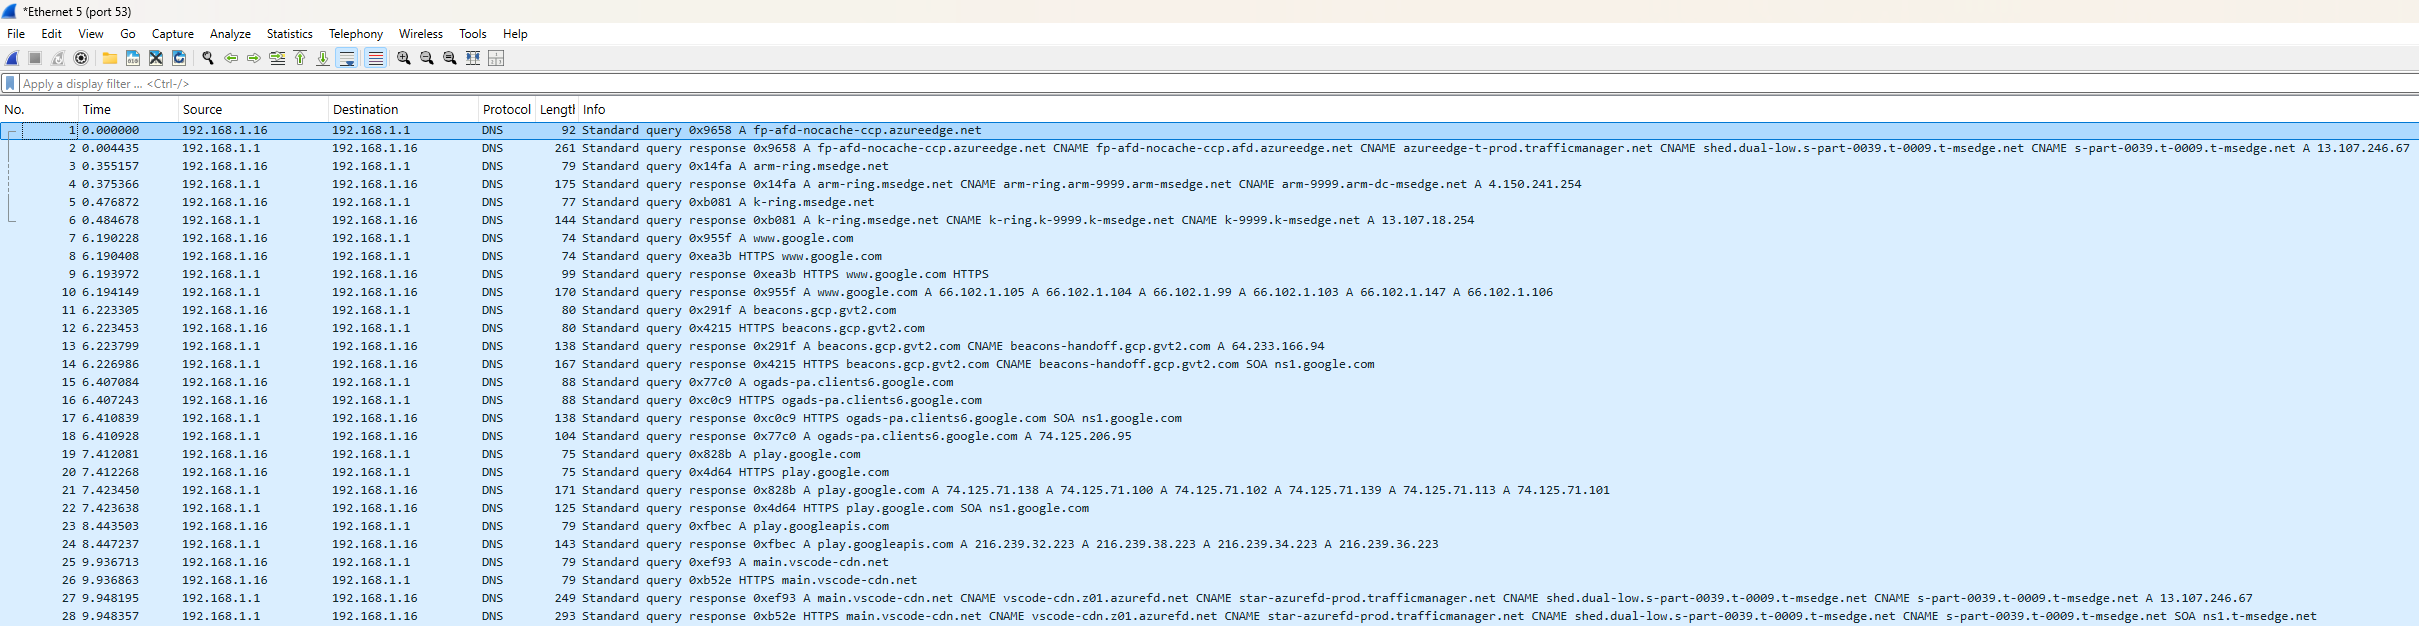
We'll solidify our understanding through an exercise. In this exercise, we'll create and apply a DNS capture filter.
# 4 Using display filters
Display filters are a crucial part of working with Wireshark, making it much easier to pinpoint specific data quickly. Like finding a needle in a haystack. It's important to note that display filters are entirely different from capture filters in both purpose and syntax.
4.1 Display filter syntax
The simplest display filters are typically based on specific protocols or applications.
Here are a few examples:
Protocol filters:
| Syntax | Description |
|---|---|
| arp | Displays all ARP traffic including gratuitous ARPs, ARP requests, and ARP replies |
| ip | Displays all IPv4 traffic including packets that have IPv4 headers embedded in them (such as ICMP destination unreachable packets that return the incoming IPv4 header after the ICMPheader) |
| ipv6 | Displays all IPv6 traffic including IPv4 packets that have IPv6 headers embedded in them, such as 6to4, Teredo, and ISATAP traffic |
| tcp | Displays all TCP‐based communications |
| icmp | Displays all ICMP traffic |
Application filters:
| Syntax | Description |
|---|---|
| dhcp | Displays all DHCP traffic |
| dns | Displays all DNS traffic including TCP‐based zone transfers and the standard UDP‐based DNS requests and responses |
| tftp | Displays all TFTP (Trivial File Transfer Protocol) traffic |
| http | Displays all HTTP commands, responses and data transfer packets, but does not display the TCP handshake packets, TCP ACK packets or TCP connection teardown packets |
Field existence filters:
| Syntax | Description |
|---|---|
| dhcp.option.hostname | Displays all DHCP traffic that contains a host name |
| http.host | Displays all HTTP packets that have the HTTP host name field. This packet is sent by the clients when they send a request to a web server |
| ftp.request.command | Displays all FTP traffic that contains a command, such as the USER, PASS, or RETR commands |
Characteristic filters:
| Syntax | Description |
|---|---|
| tcp.analysis.flags | Displays all packets that have any of the TCP analysis flags associated with them. This includes indications of packet loss, retransmissions, or zerowindow conditions |
| tcp.analysis.zero_window | Displays packets that are flagged to indicate the sender has run out of receive buffer space |
It's important to note that display filters are case-sensitive and color coding is applied.
| Color | Message |
|---|---|
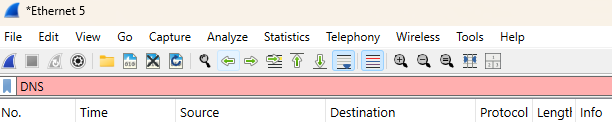
| Red | Syntax check failed |
| Green | Syntax check passed |
| Yellow | Syntax check passed with a warning |
Comparison operators can also be used. Here are a few examples:
| Syntax | Description |
|---|---|
| ip.src == 10.2.2.2 | Display all IPv4 traffic from 10.2.2.2 |
| tcp.srcport != 80 | Display all TCP traffic from any port except port 80 |
| frame.time_relative > 1 | Display packets that arrived more than 1 second after the previous packet in the trace file |
| tcp.window_size < 1460 | Display when the TCP receive window size is less than 1460 bytes |
| dns.count.answers >= 10 | Display DNS response packets that contain at least 10 answers |
| ip.ttl < 10 | Display any packets that have less than 10 in the IP Time to Live field |
| http contains "GET" | Display all the HTTP client GET requests sent to HTTP servers |
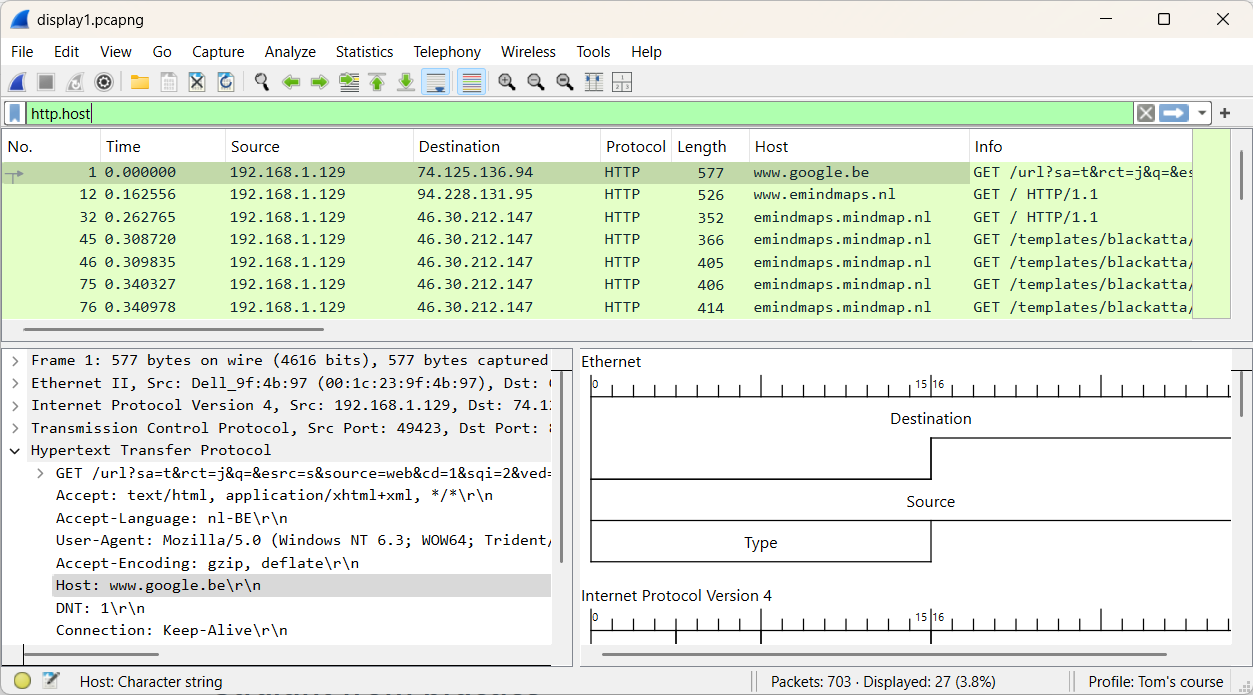
In the next exercise, you'll observe network traffic from a user visiting a website and submitting a web form. The following file will be used: display1.pcapng (opens new window)
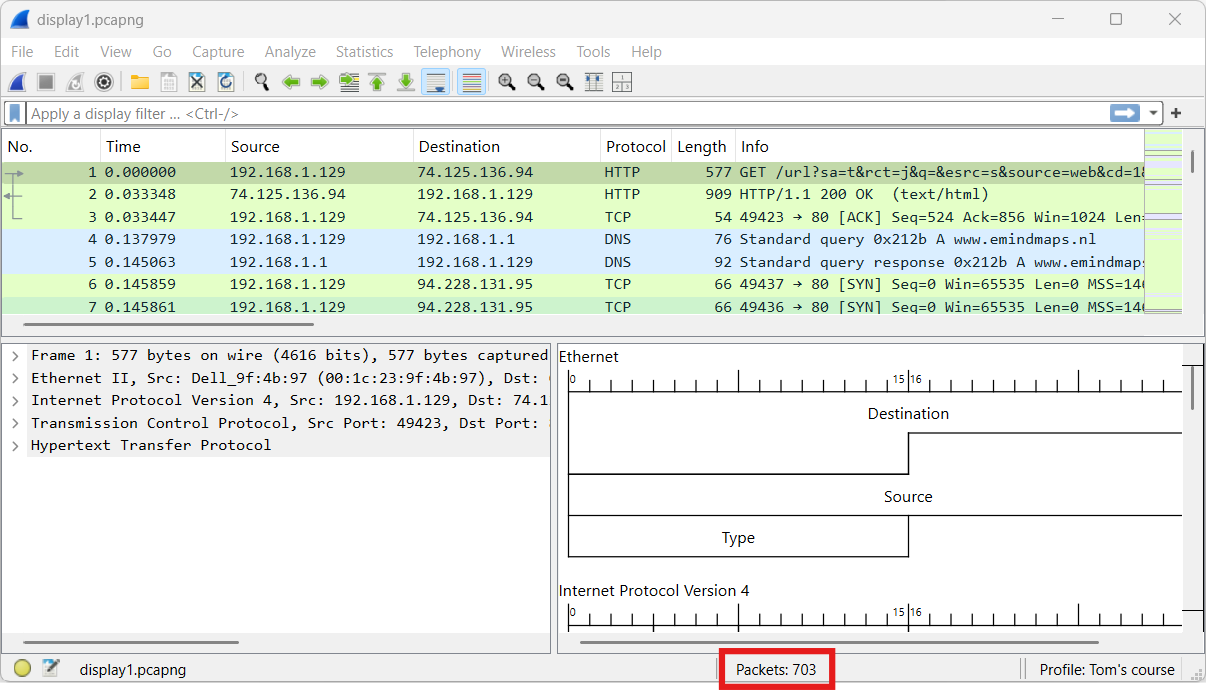
Without applying a display filter, we can see a total of 703 packets.
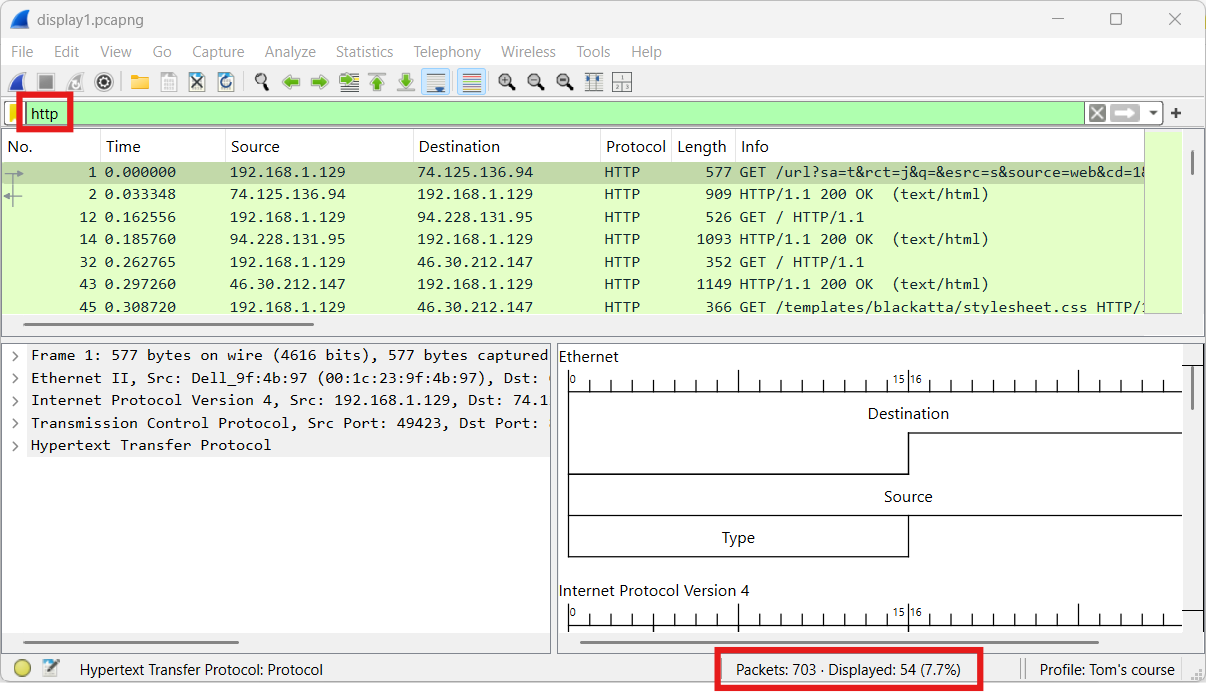
Applying the http display filter results in a reduction of over 90% in the number of visible packets.
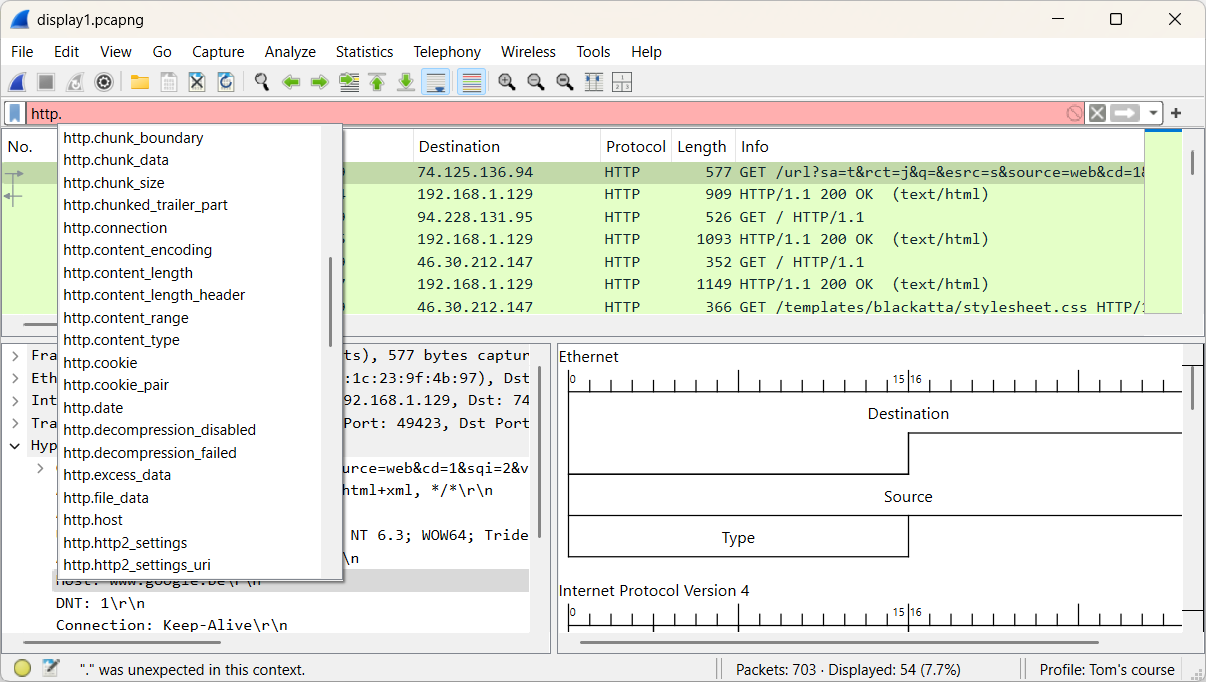
By using the drop-down menu, we can view all available HTTP filter options. Let’s explore the different HTTP hosts that were accessed.
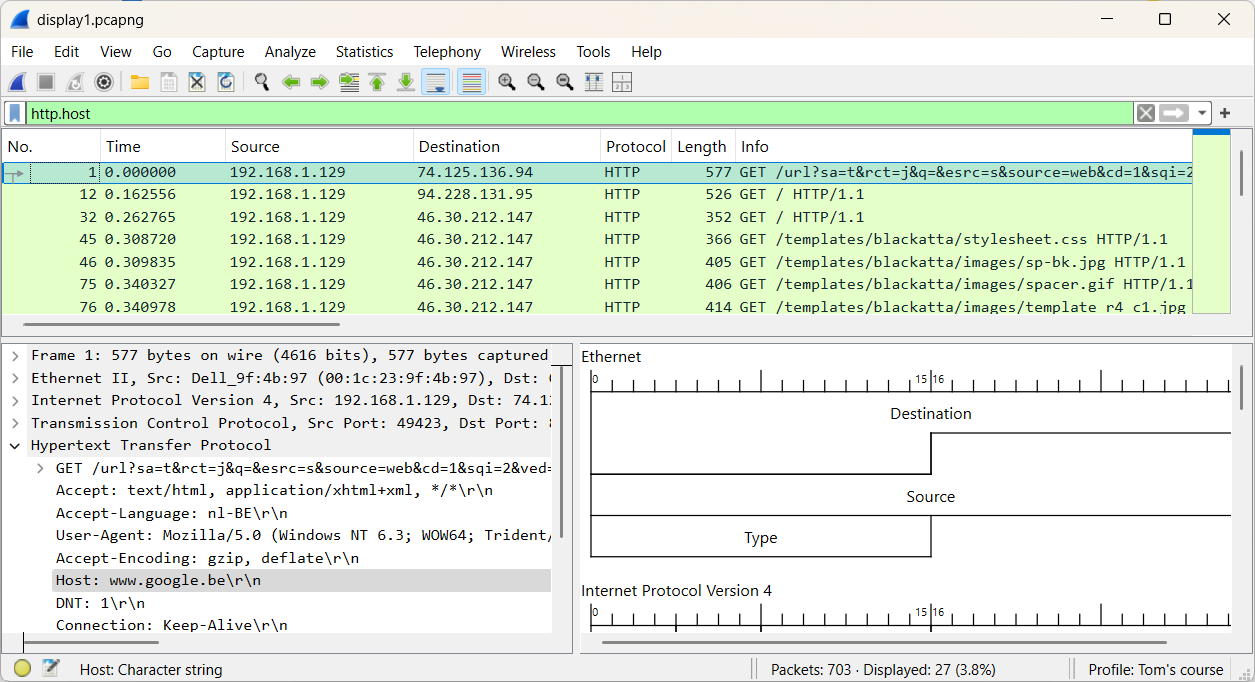
Since we're still dealing with 27 packets, this method isn't the most efficient for our search. Adding an extra column can provide additional clarity and make the process easier.
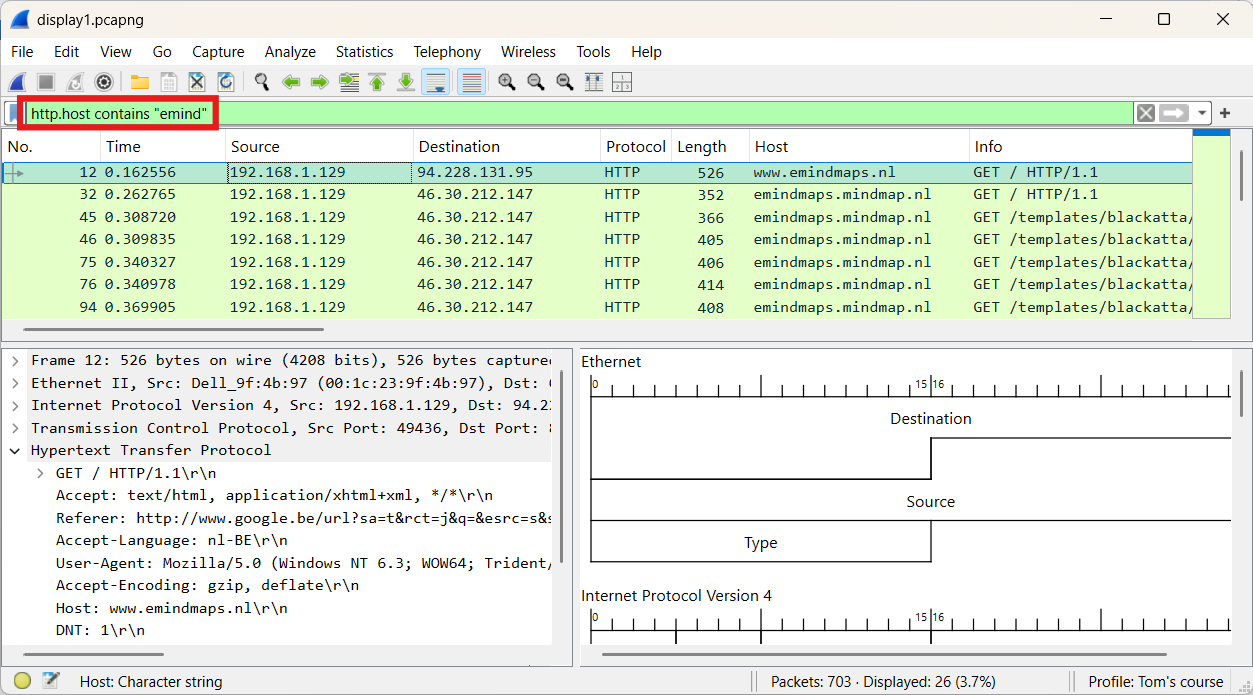
Let’s now search for all hosts that include “emind” in their name.
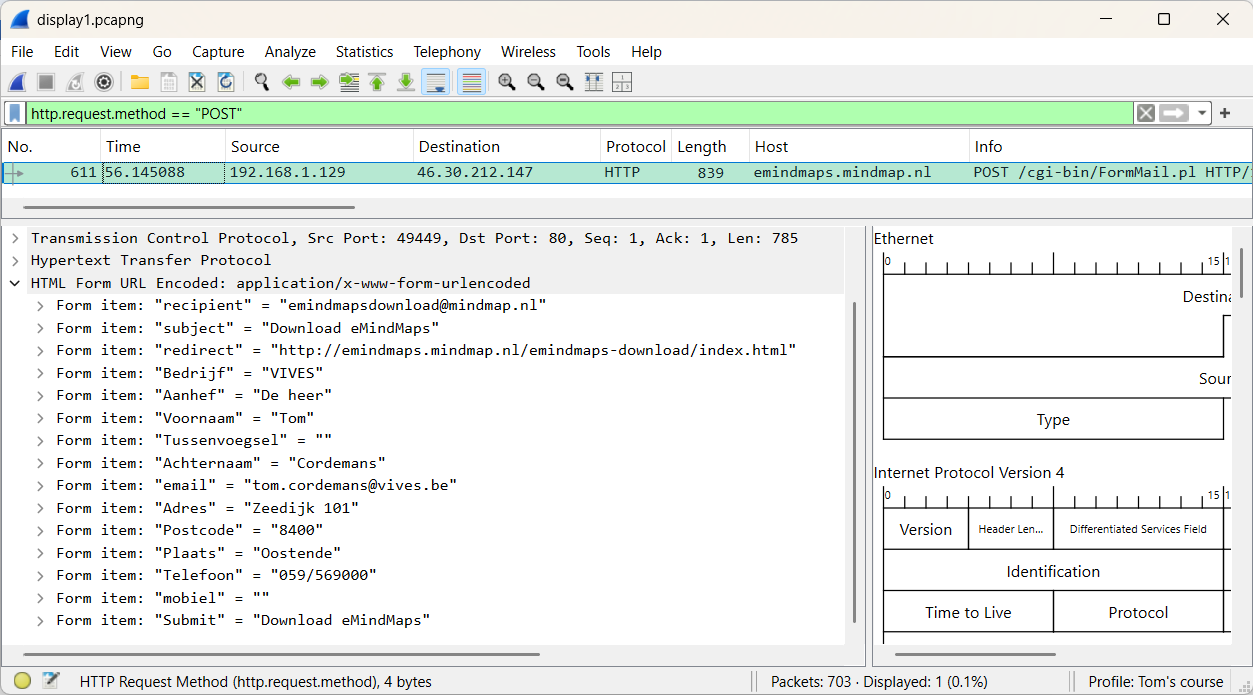
Next, we’ll focus on finding information related to submitting the web form. To do this, we’ll apply the display filter http.request.method == "POST".
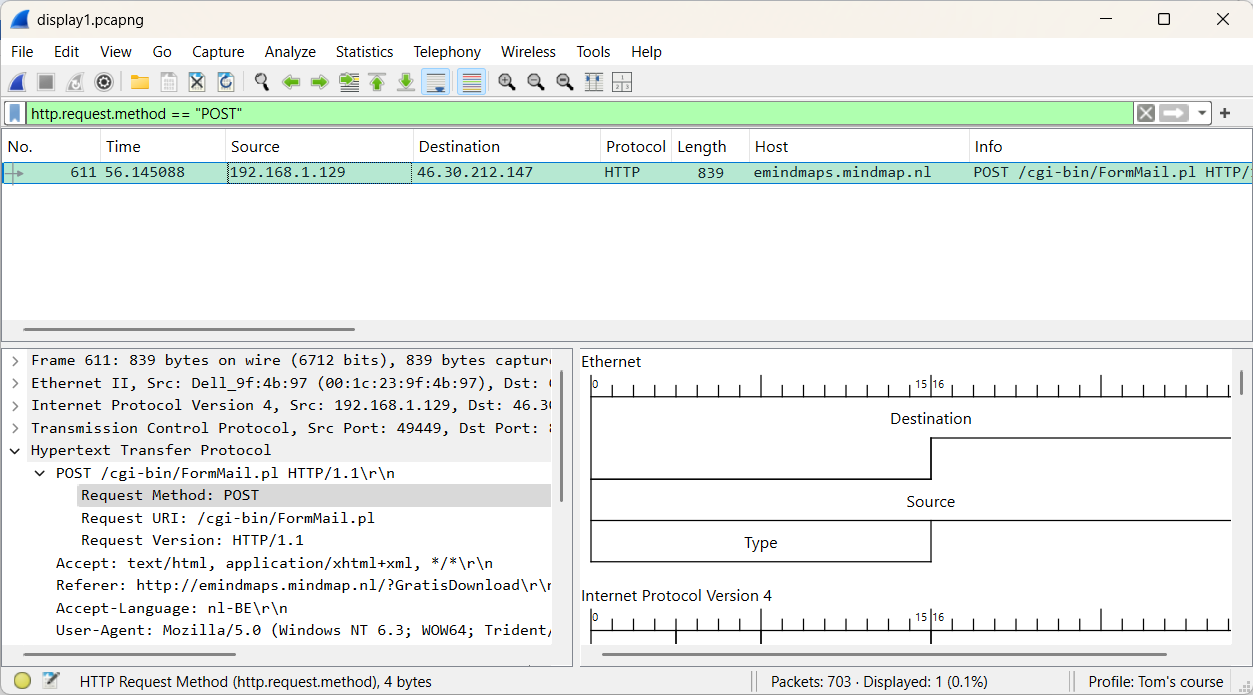
The packet details pane shows that packet 611 includes all the form data submitted by the user.
Here’s another task: examine the difference between the display filter http and tcp.port == 80.
What is your conclusion?
Display filters can also be created based on IP addresses and subnets.
Here are a few examples:
| Syntax | Description |
|---|---|
| ip.addr==10.3.1.1 | Display frames that have 10.3.1.1 in the IP source address field or the IP destination address field |
| !ip.addr==10.3.1.1 | Display all frames except frames that have 10.3.1.1 in the IP source address field or 10.3.1.1 in the IP destination address field |
| ip.src==10.3.1.1 | Display traffic from 10.3.1.1 |
| ip.dst==10.3.1.1 | Display traffic to 10.3.1.1 |
| ip.host==www.wireshark.org | Display traffic to or from the IP address that resolves to www.wireshark.org |
| ip.addr > 10.3.0.1 && ip.addr < 10.3.0.5 | Display traffic to or from 10.3.0.2, 10.3.0.3 or 10.3.0.4 |
| (ip.addr >= 10.3.0.1 && ip.addr <= 10.3.0.6) &&!ip.addr==10.3.0.3 | Display traffic to or from 10.3.0.1, 10.3.0.2, 10.3.0.4, 10.3.0.5 or 10.3.0.6 . But the IP address10.3.0.3 is excluded from the range specified |
| ip.addr==10.3.0.0/16 | Display traffic that contains an IP address starting with 10.3 in the source IP address field or destination IP address field |
| ip.addr==10.3.0.0/16 && !ip.addr==10.3.1.1 | Display traffic that contains an IP address starting with 10.3 in the source IP address field or destination IP address field except 10.3.1.1 |
| !ip.addr==10.3.0.0/16 && !ip.addr==10.2.0.0/16 | Display all traffic except traffic that contains an IP address starting with 10.3 or 10.2 in the source IP address field or destination IP address field |
In the next exercise, you'll observe network traffic from and to a video streaming website. We aim to map the network traffic.
The following file will be used: display2.pcapng (opens new window)
First, we apply the dns display filter.
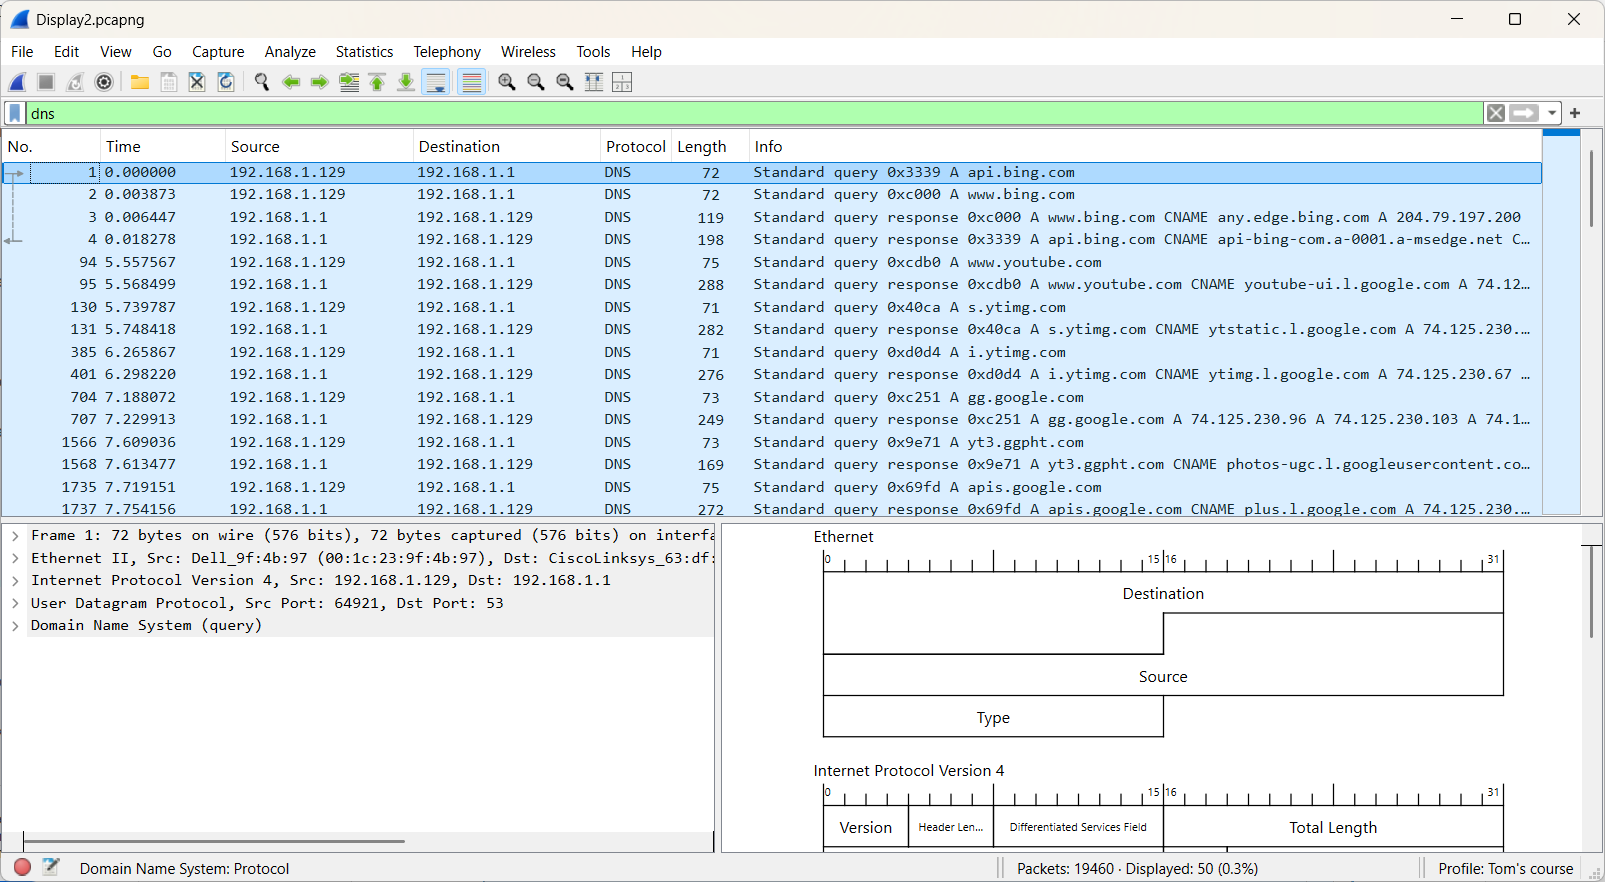
Frame 94 displays a DNS query for www.youtube.com. Let's create a new display filter that specifically targets DNS queries containing the word "youtube."
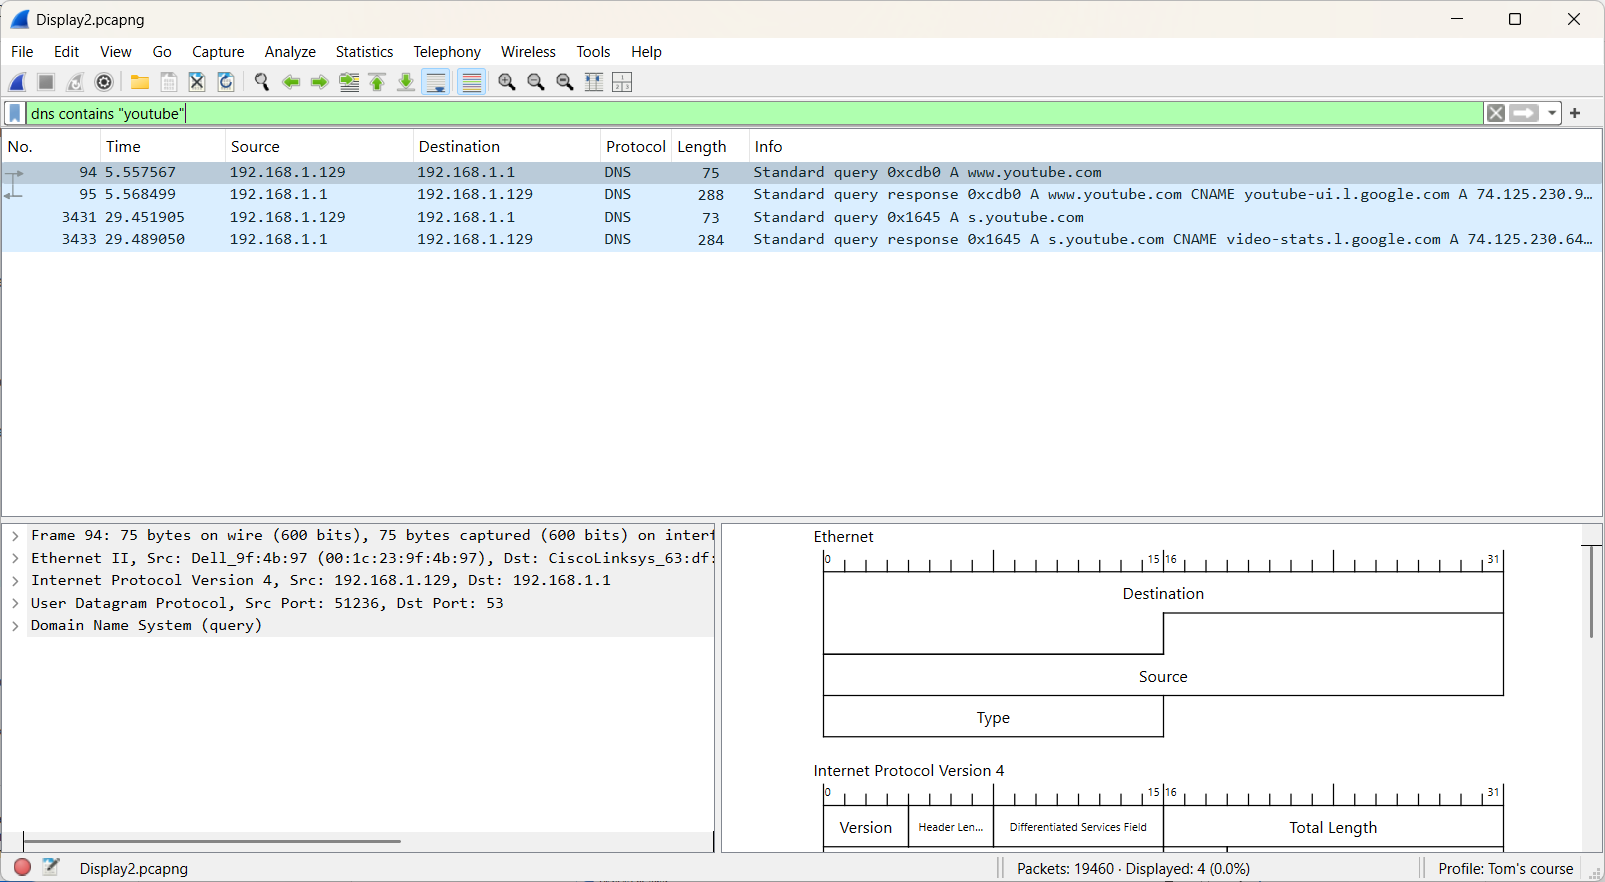
The DNS response packets (frames 95 and 3433) reveal the IP addresses associated with YouTube. The lowest address is 74.125.230.64, and the highest is 74.125.230.110. Based on this range, we can determine that all addresses fall within the subnet 74.125.230.64/26.
Let's create a new display filter that specifically targets the subnet 74.125.230.64/26.
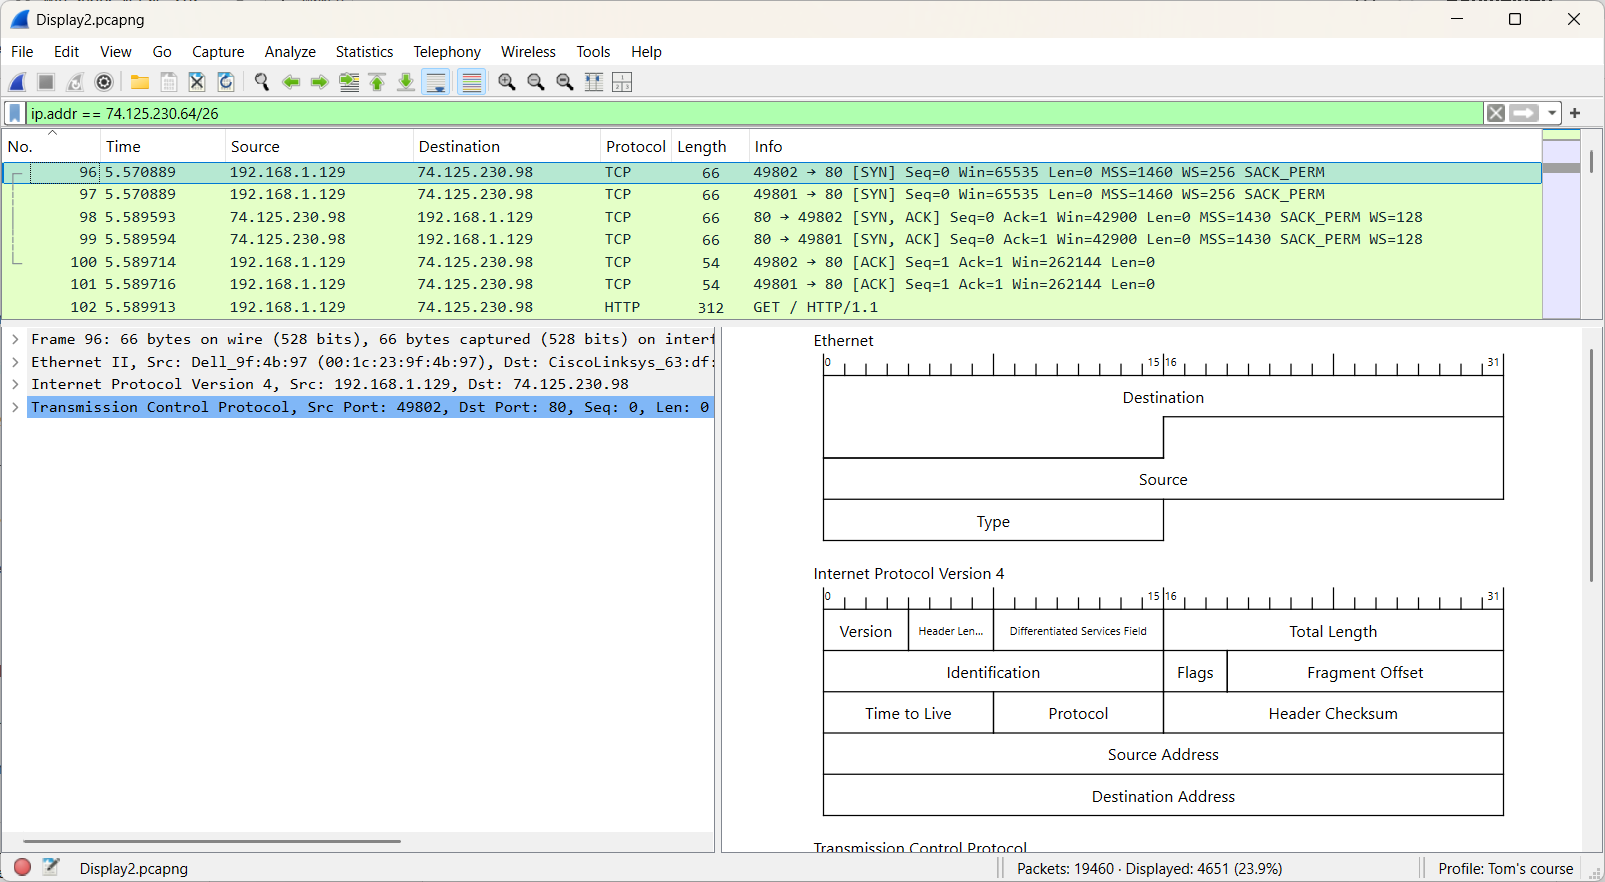
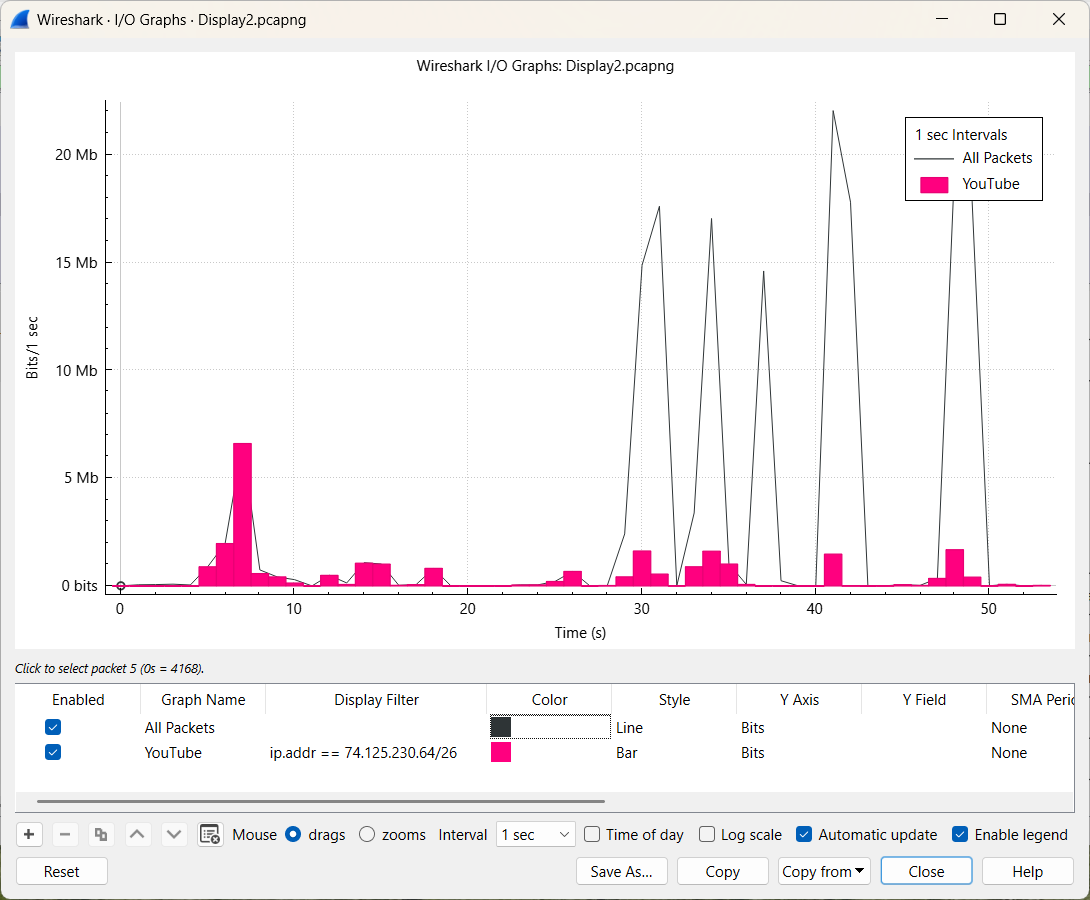
Based on the results, we can conclude that 23.9% of the frames are related to YouTube. However, this doesn't provide any insight into the actual bandwidth usage, as frame sizes can vary significantly.
However, a clearer understanding of the consumed bandwidth can be achieved through graphical visualization. The detailed construction of this graph will be addressed later in the course.
In the next exercise, we’ll explore various options to more efficiently filter specific types of network traffic. In particular, we'll focus on identifying DNS and HTTP error responses.
The following file will be used: display3.pcapng (opens new window)
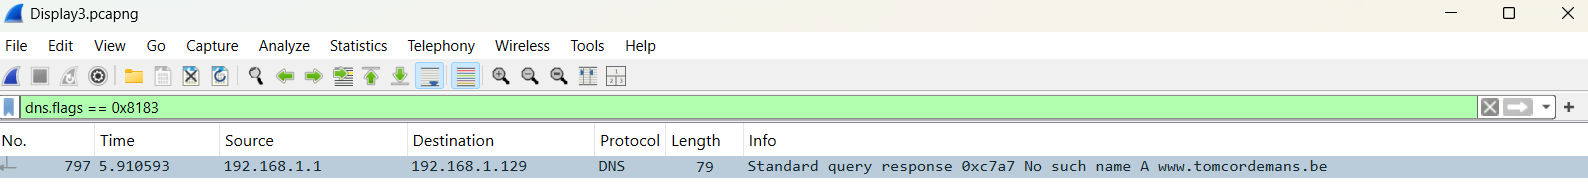
In frame 797 you can find in the DNS section “Reply code: No such name (3)”.
Perform the following actions.
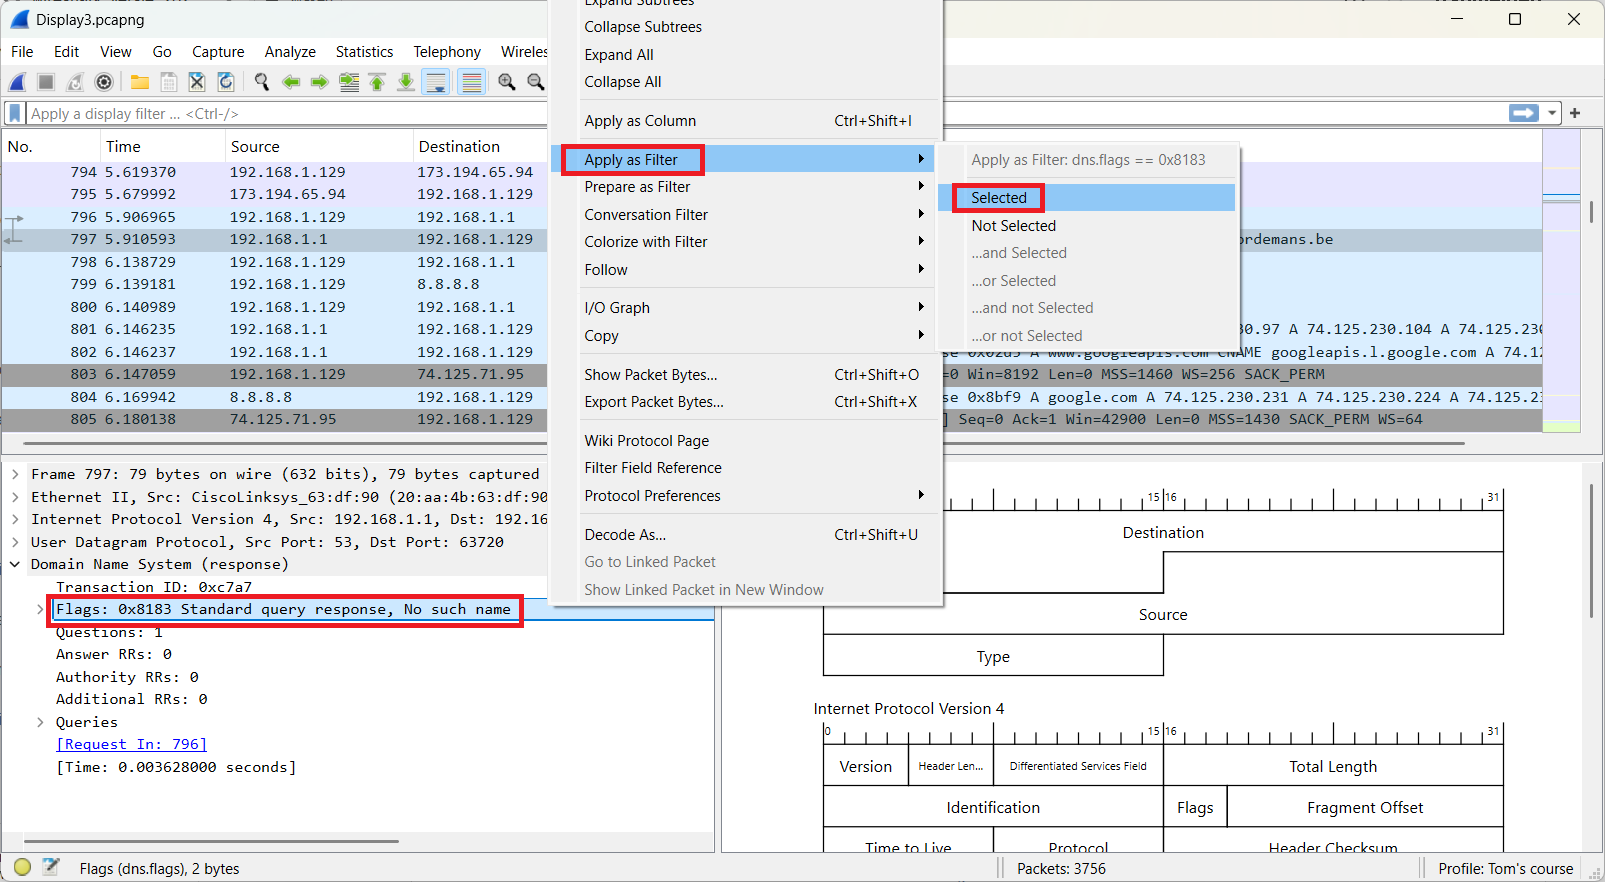
This results in the following outcome.
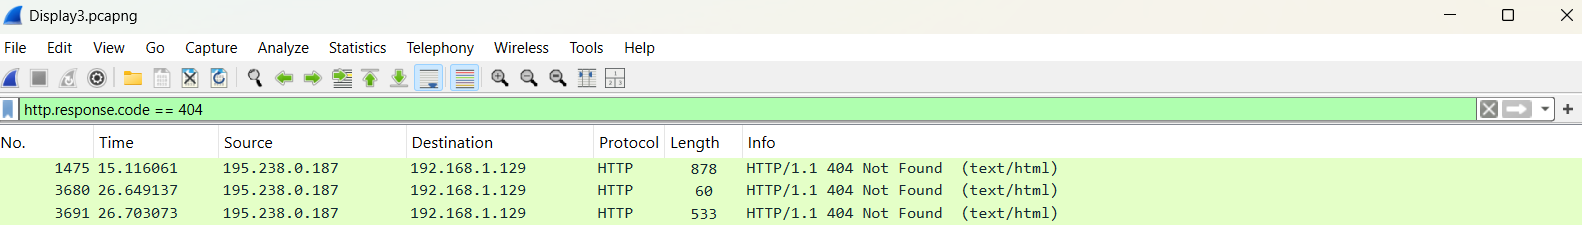
In frame 3691 you will find the status code 404 in the HTTP section. Use this as a display filter.
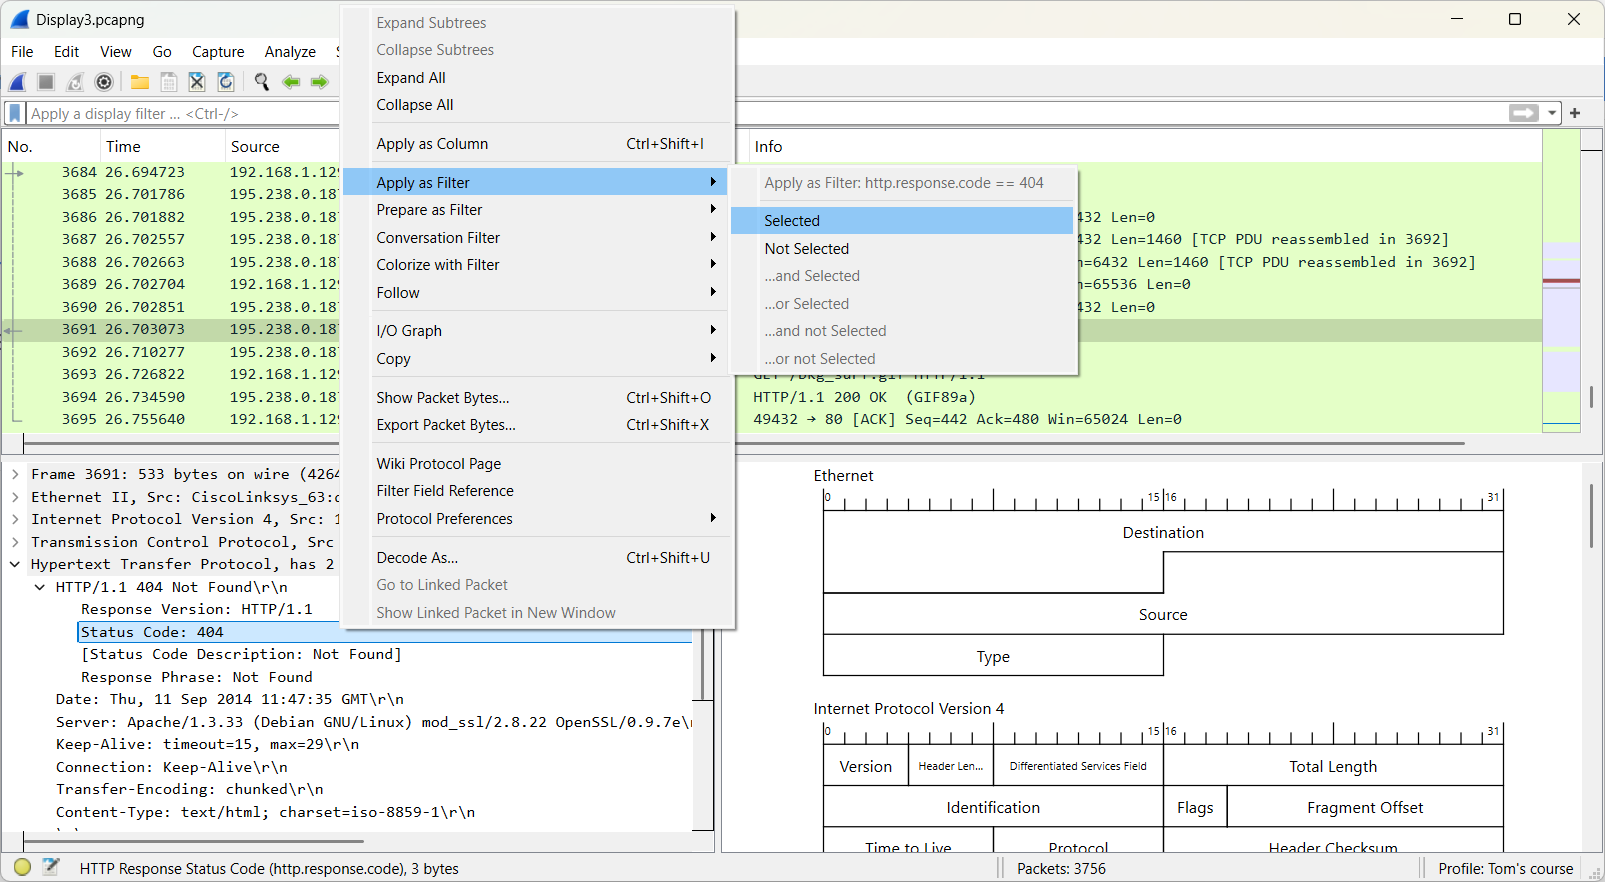
This leads to the following result.
Filtering a specific TCP or UDP conversation can also be useful. An exercise will be used to demonstrate the four different methods.
The following file will be used: display4.pcapng (opens new window)
Sure, here's a rephrased version:
A capture typically includes multiple conversations between various devices, which can make it challenging to locate specific information. Focusing on a particular conversation can help simplify this task.
In this exercise, we aim to identify the conversation that contains frame 9.
- First method: Make use of a conversation filter
The approach is shown below.
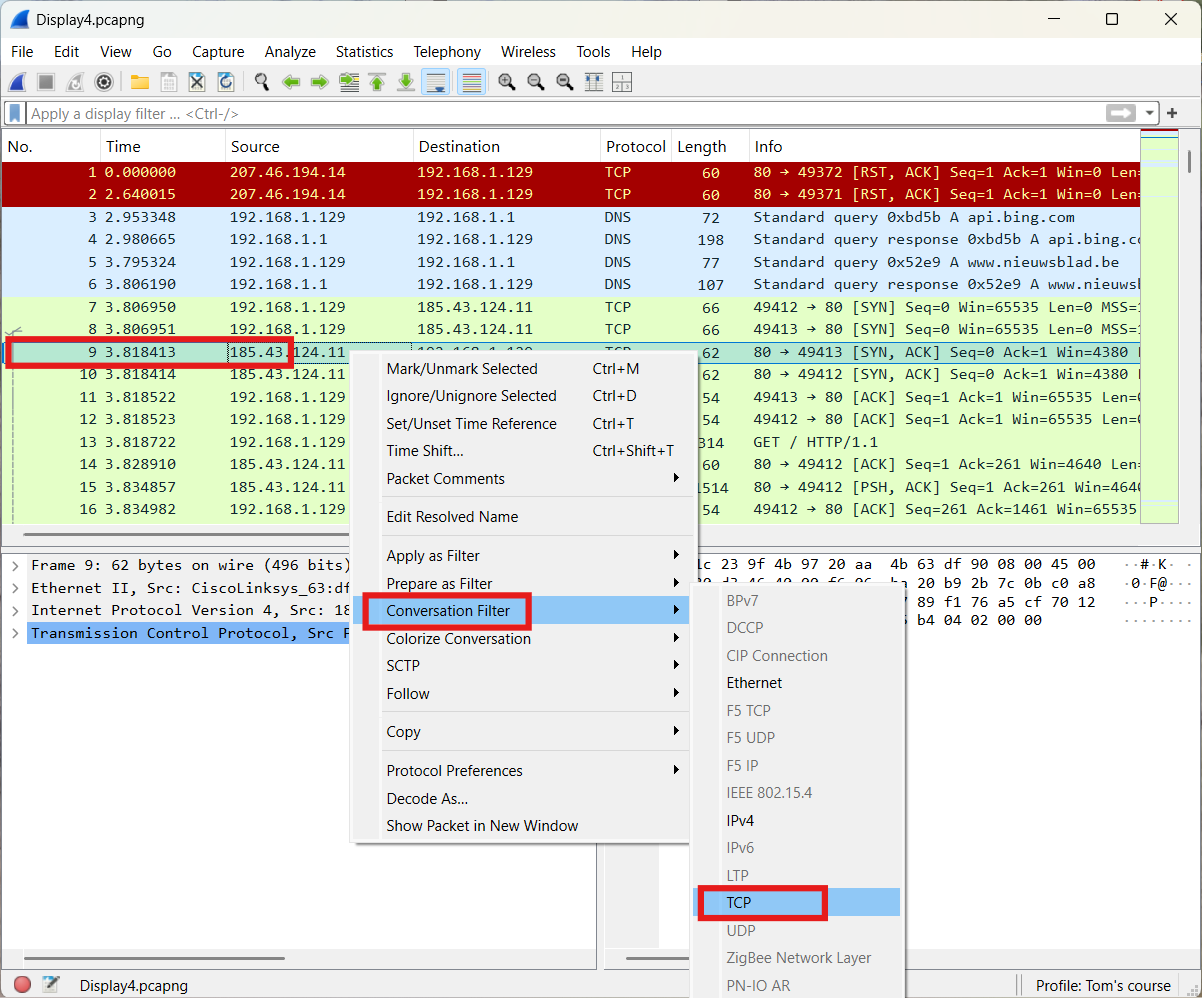
The result is presented underneath.
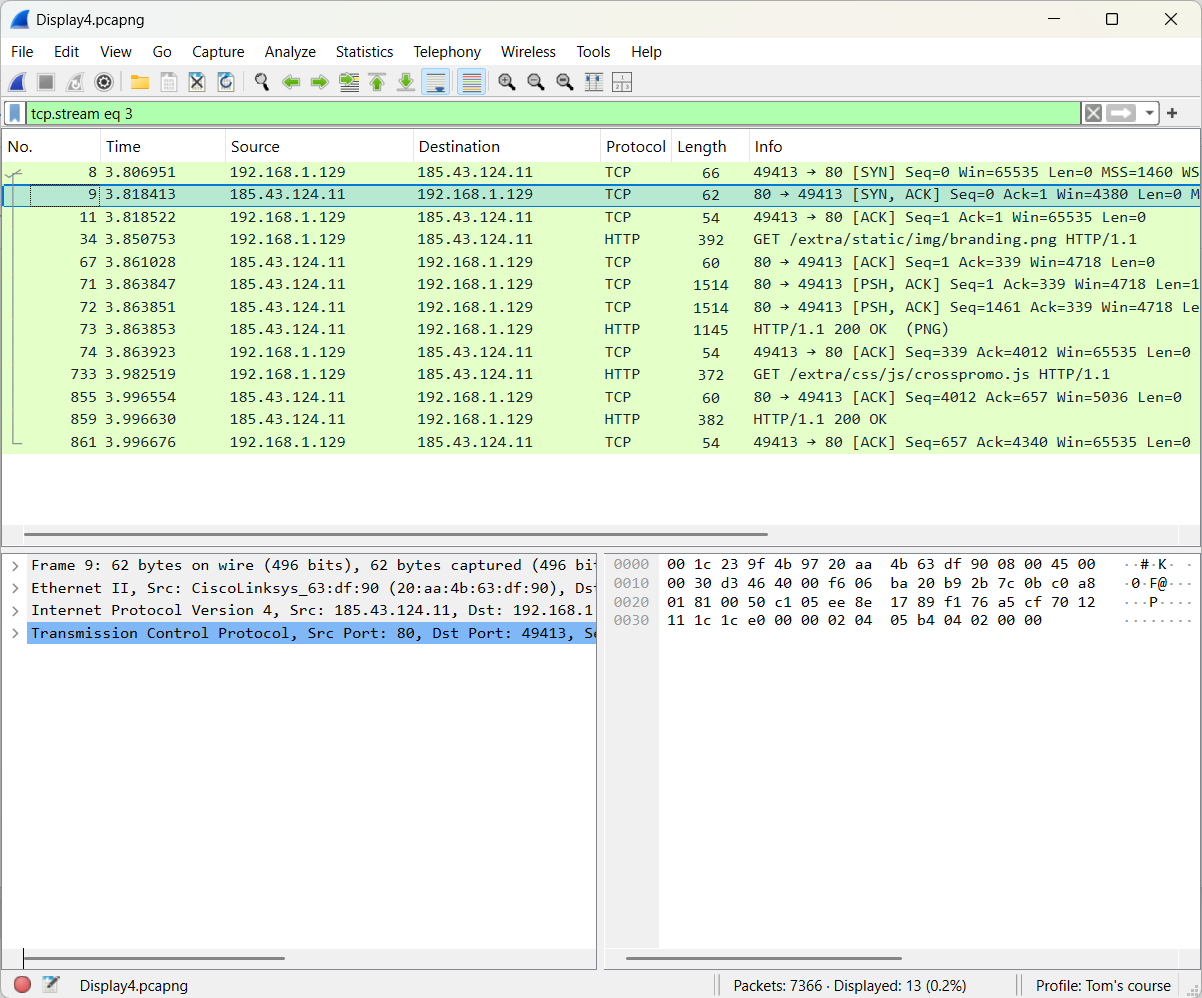
- Second method: Make use of follow a stream
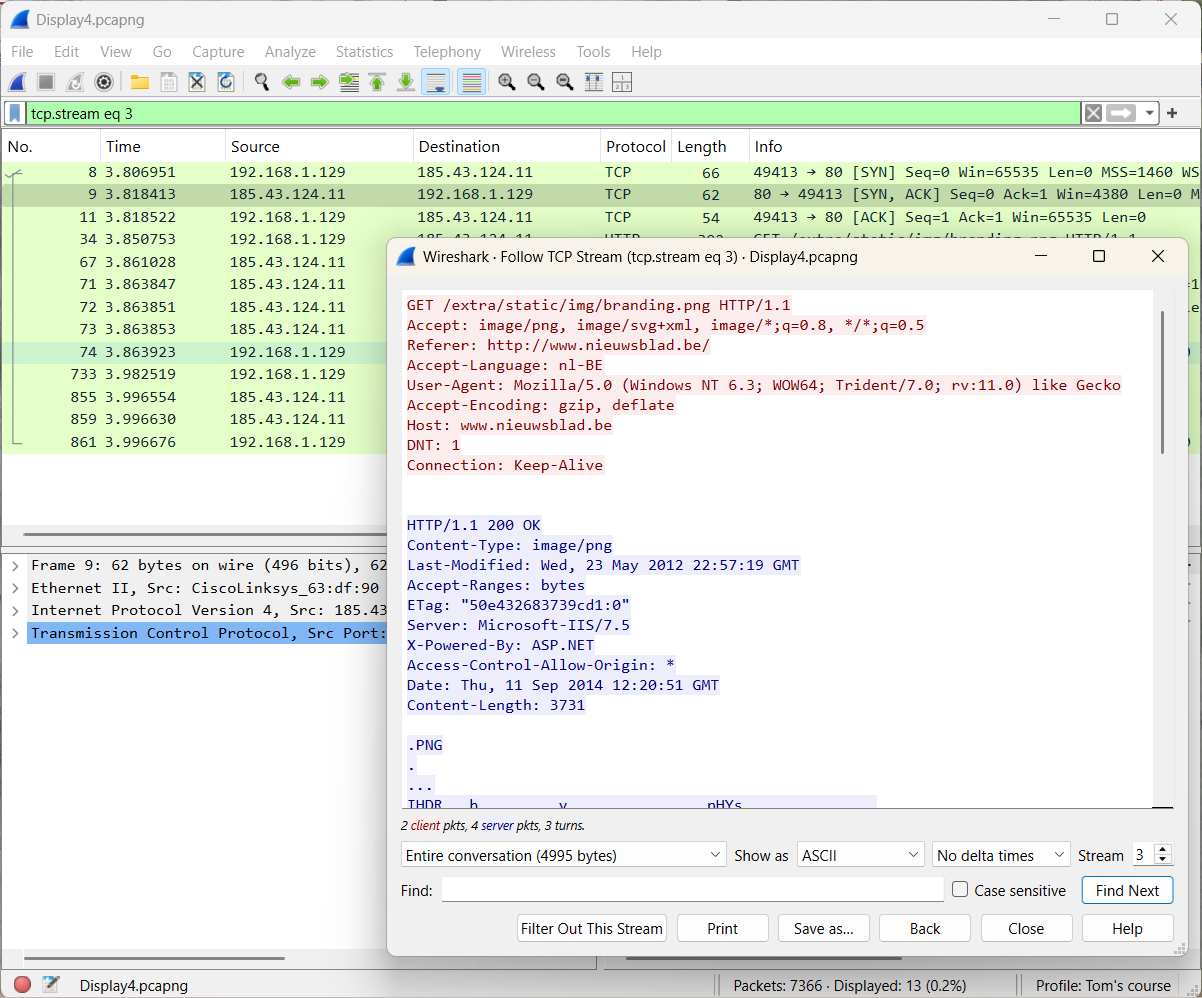
The approach is shown below.
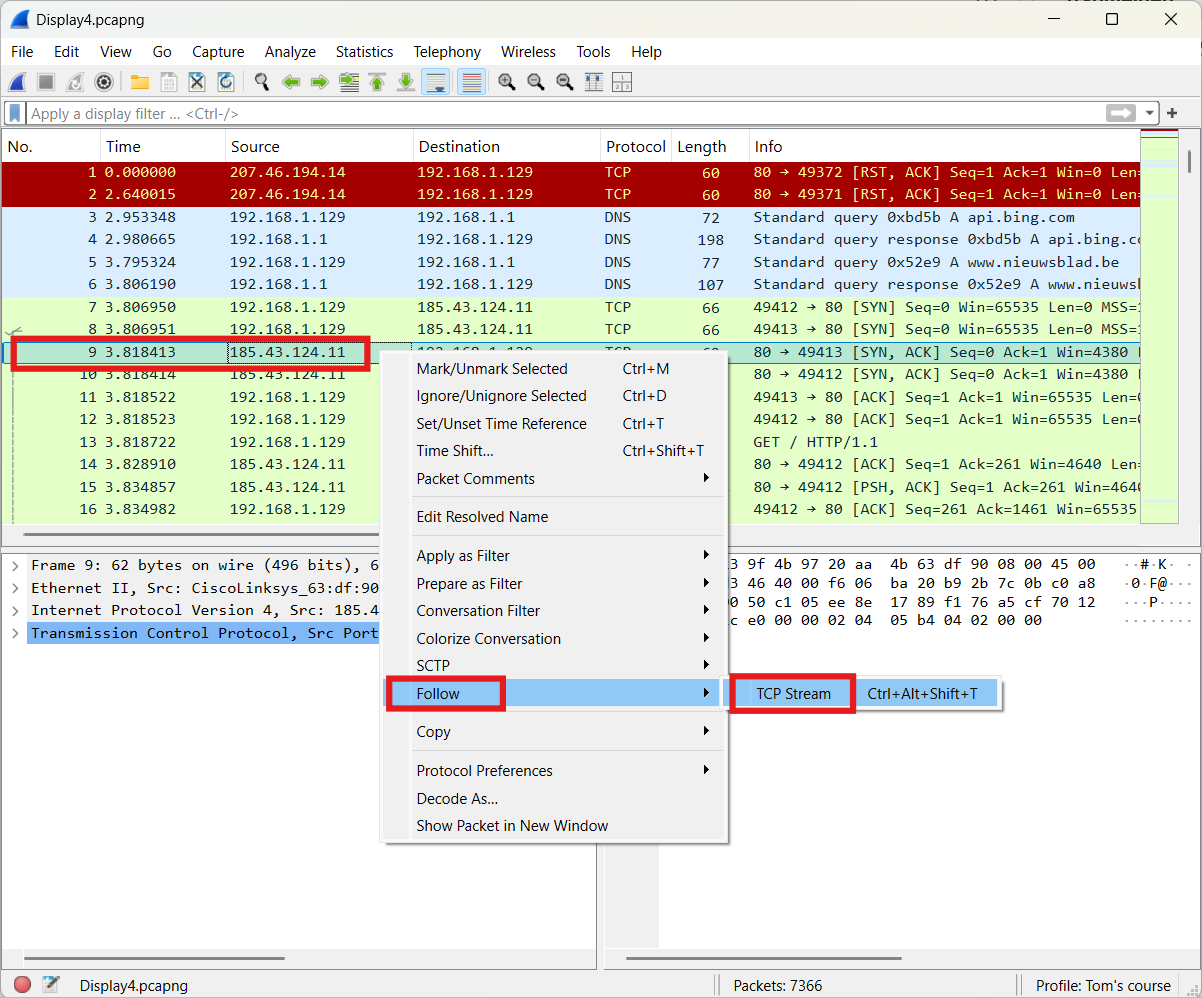
The result is presented underneath.
- Third method: Make use of Wireshark statistics
The socket pair to which frame 9 belongs is 185.43.124.11:80 and 192.168.1.129:49413. Based on this information, we use the following approach.
Go to Statistics → Conversations , then select the TCP tab and locate the specific socket pair.
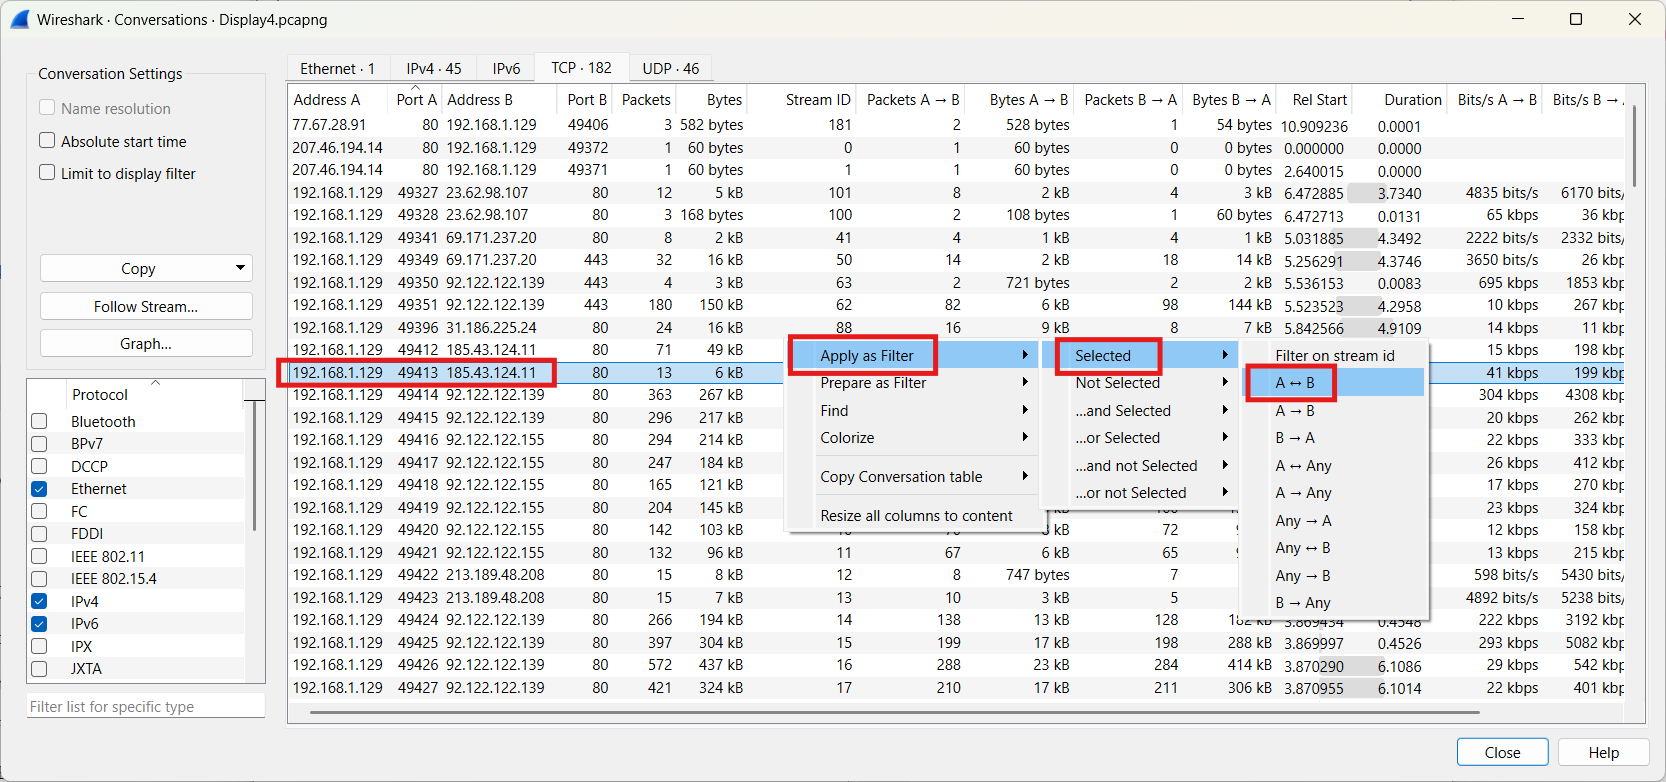
The result is presented underneath.
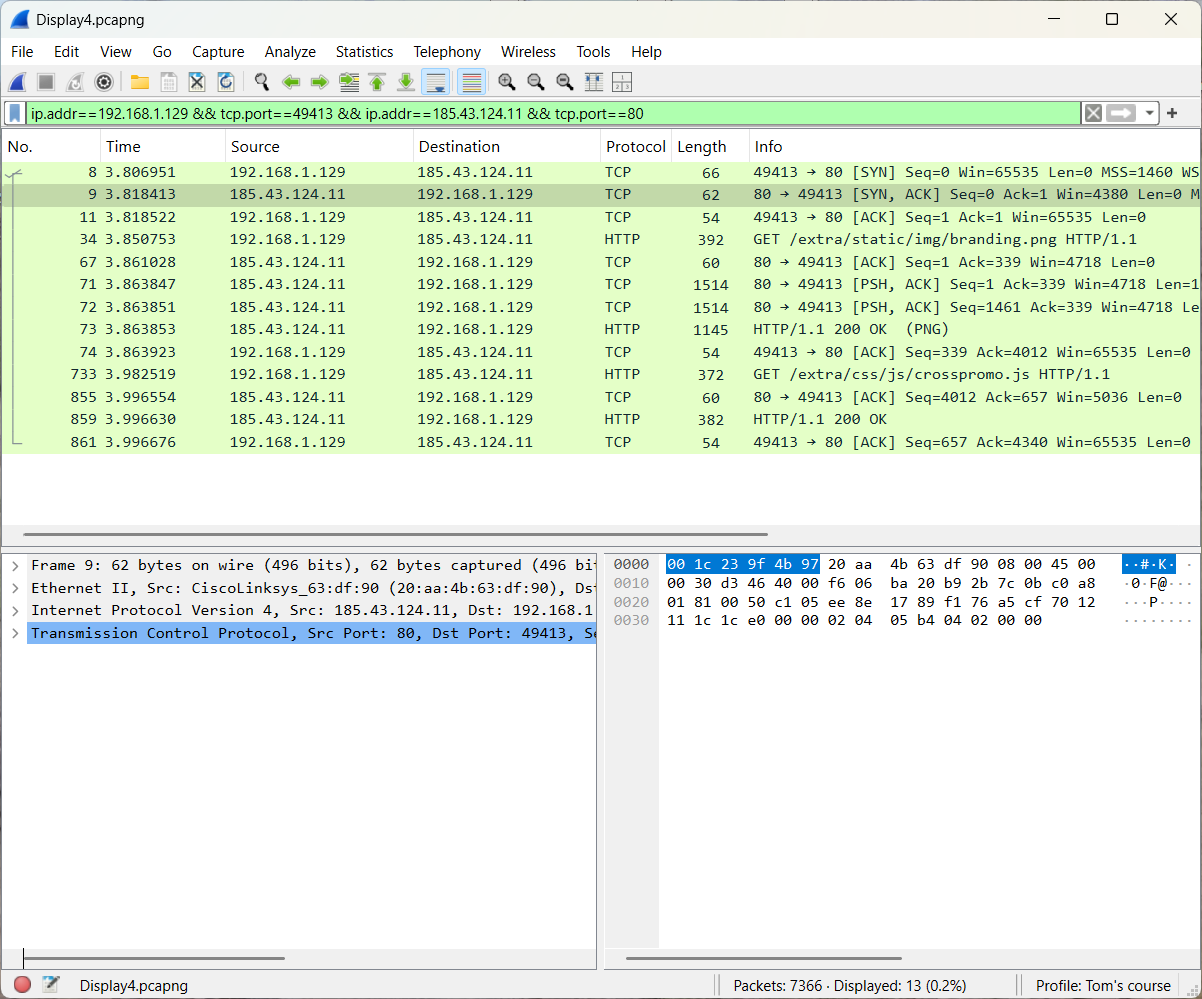
- Forth method: Make use of the stream index field
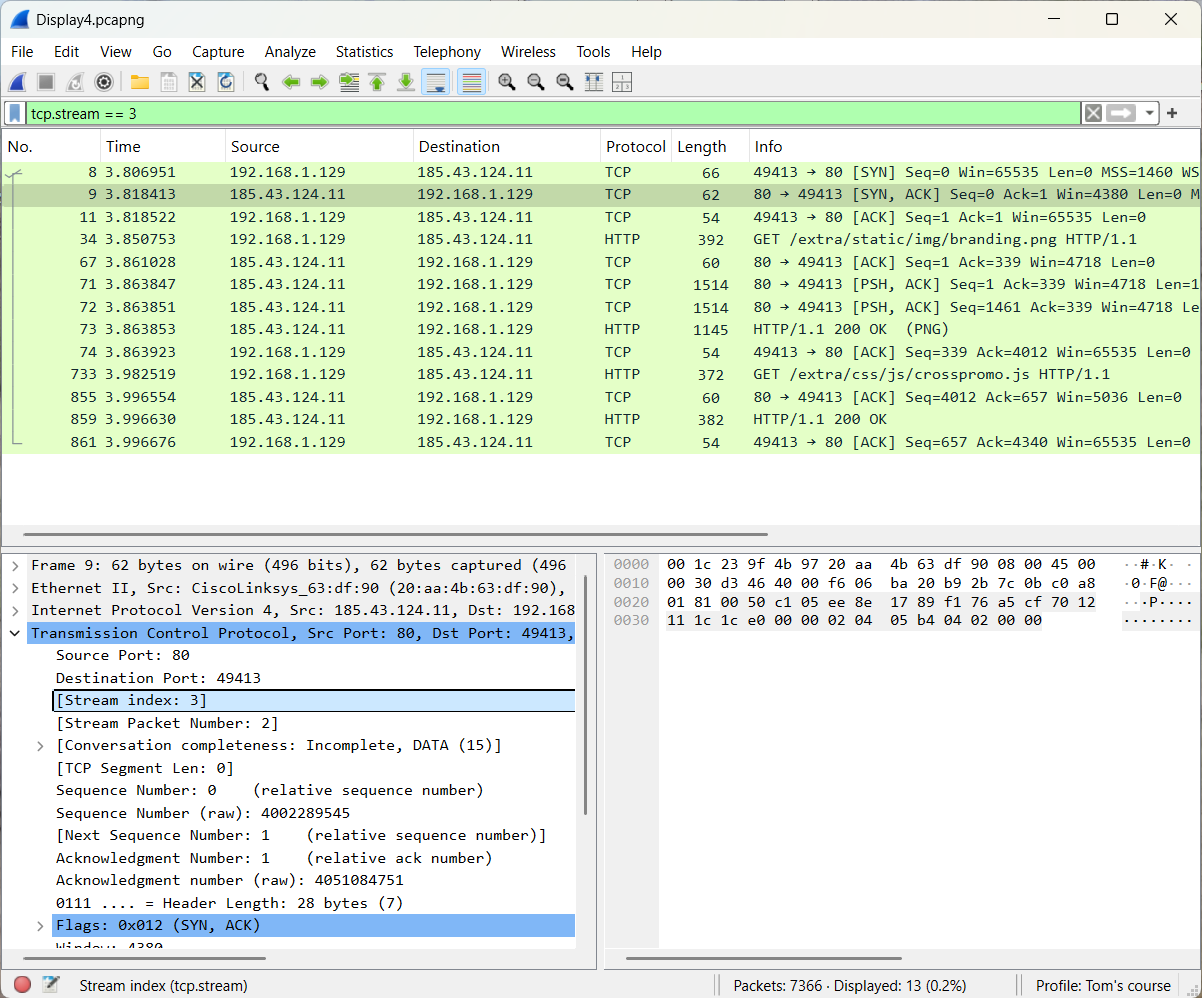
The approach is shown below.
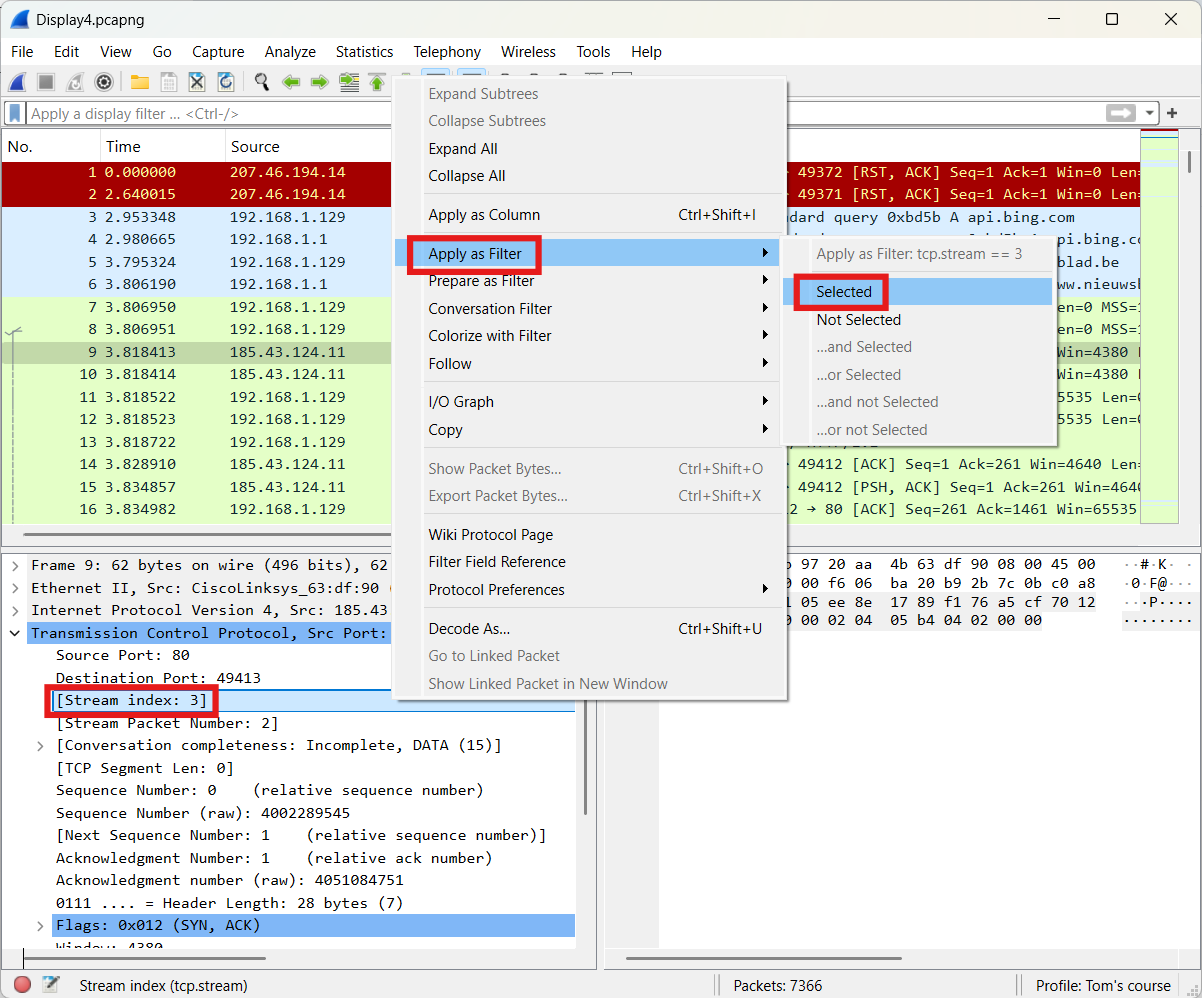
Note: You can also drag any field to the filter toolbar.
The result is presented underneath.
4.2 Display filter practice
Part 1
Incoming TCP connections to a server are normal. However, on a regular user's computer (192.168.1.129), such connections are rather unusual.
The following file will be used: client.pcapng (opens new window)
Question: How can we detect these types of connections?Part 2
There are complaints about the performance of the computer network. Look for delays between packets within the same conversation.
The following file will be used: delay.pcapng (opens new window)
Question: In what ways can delays within a conversation be detected?
4.3 Coloring network packets
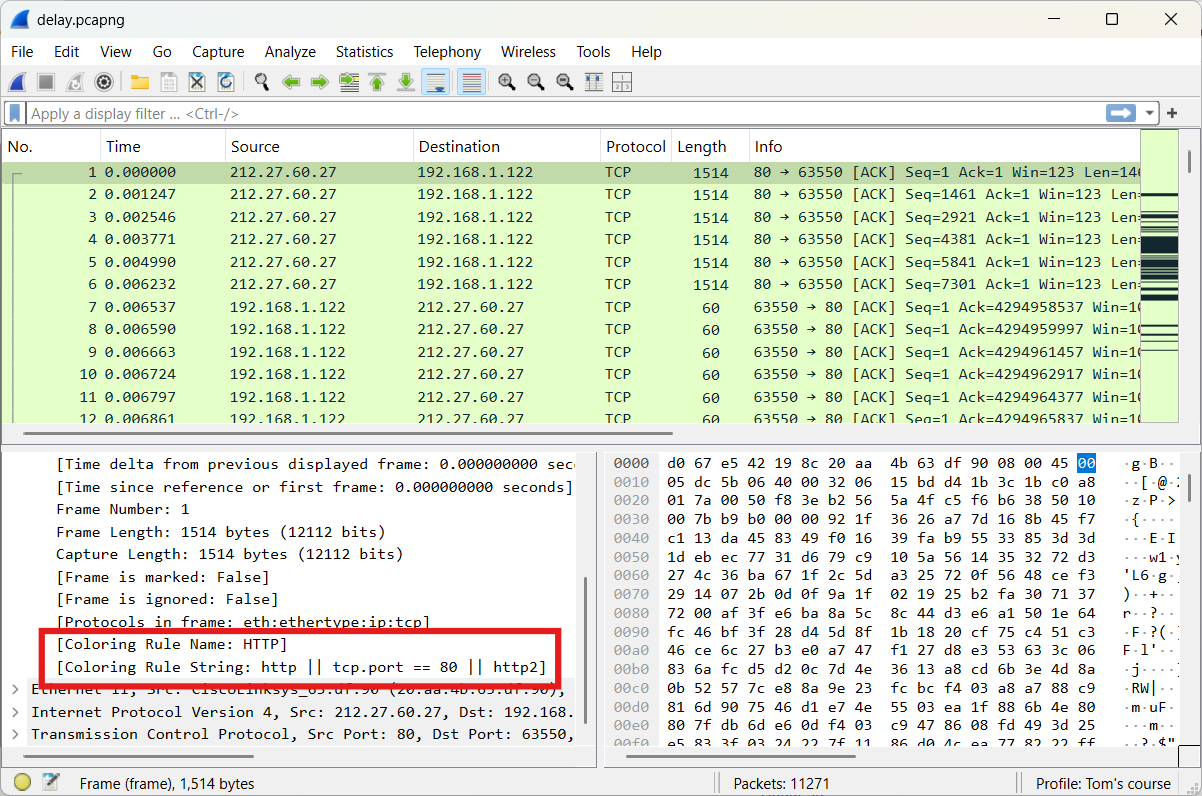
Wireshark automatically colors packets based on coloring rules.
In the frame section, you can find the Coloring Rule Name and Coloring Rule String.
Sometimes these coloring rules are also perceived as annoying. You can disable all coloring rules at once.
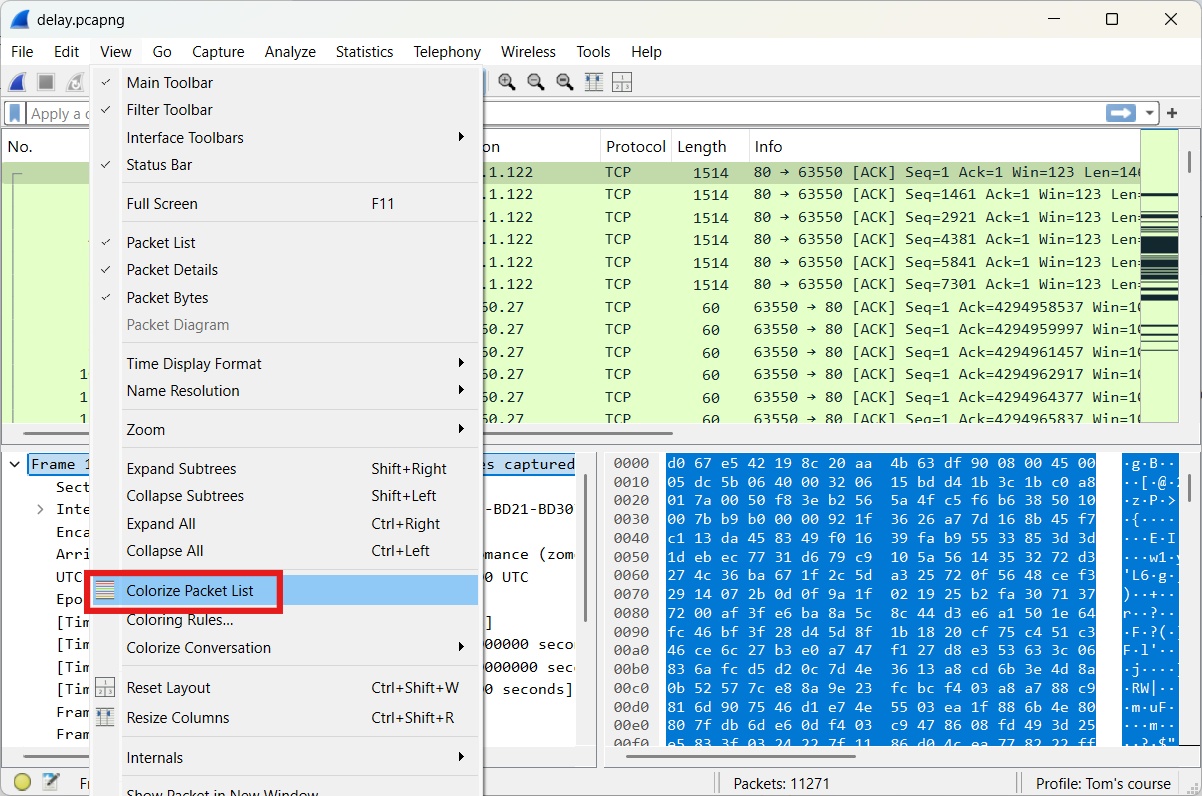
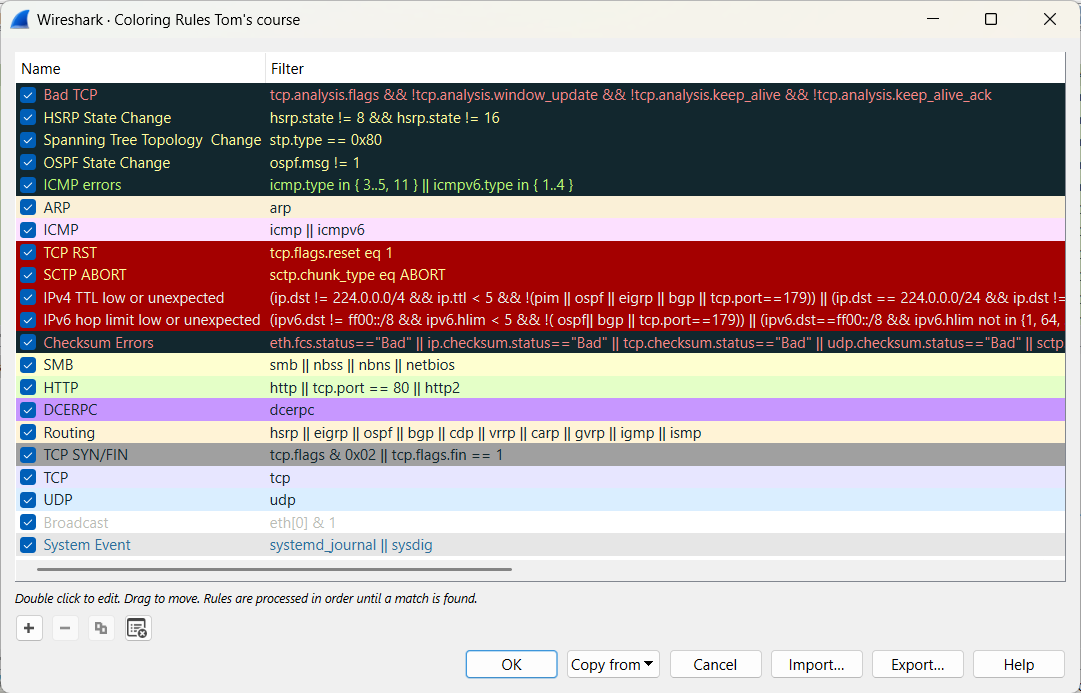
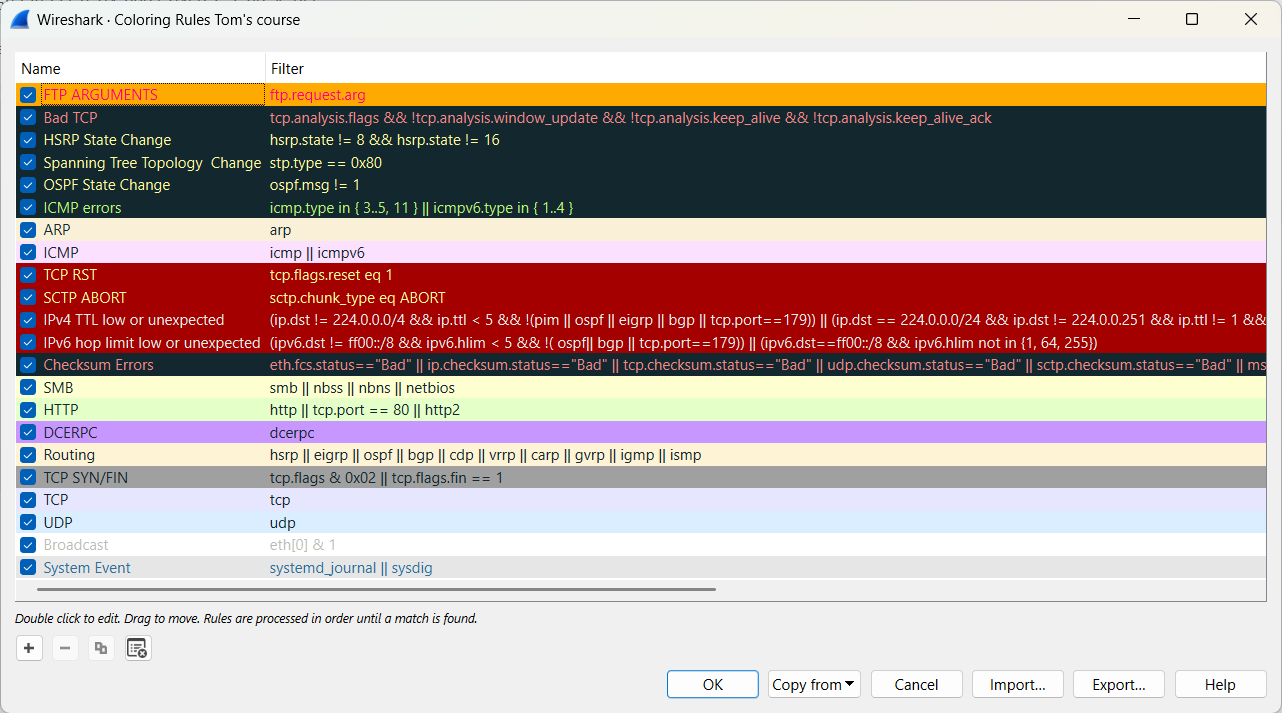
If you want to disable a specific coloring rule, you can do so via View → Coloring Rules.
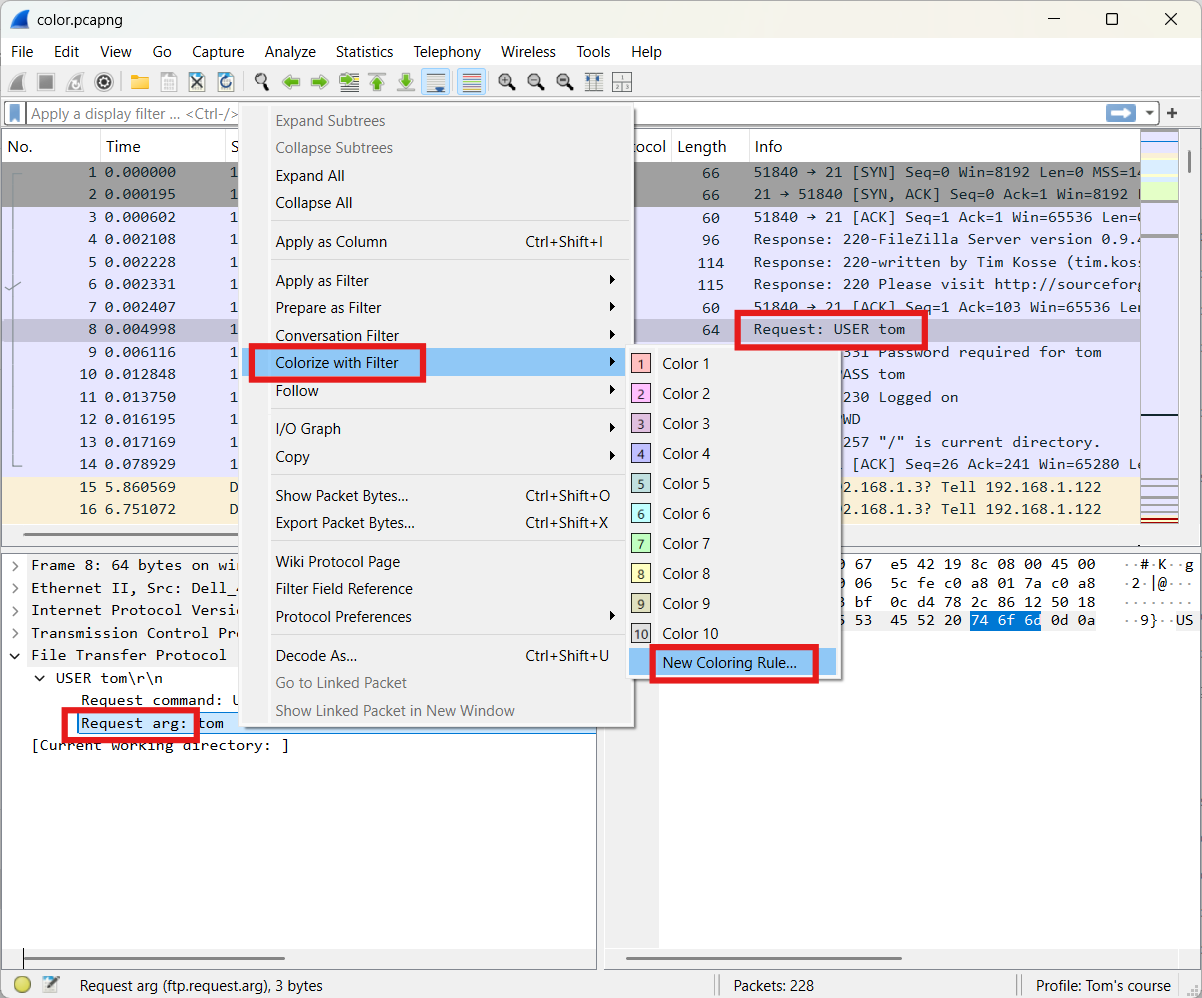
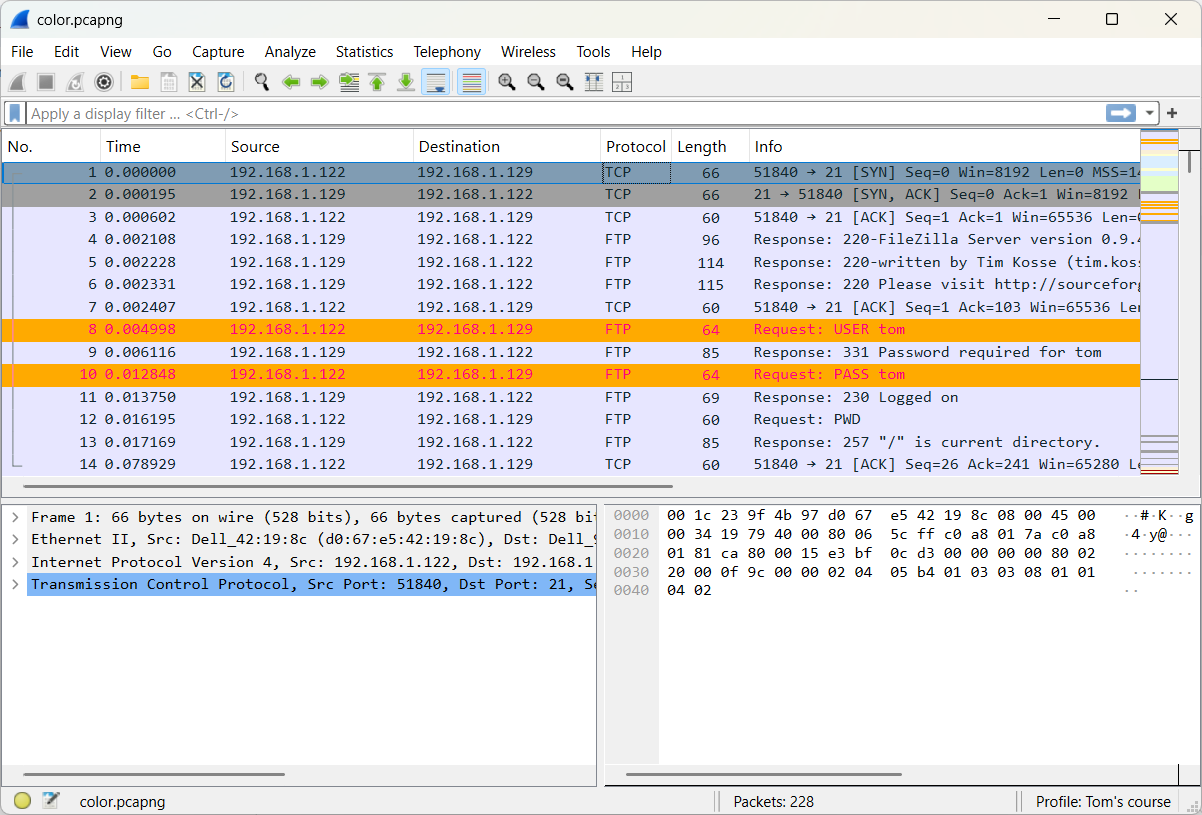
In the following exercise, you will create a coloring rule to highlight packets that contain FTP arguments. The following file will be used: color.pcapng (opens new window)
In frame 8, the info field shows Request: USER tom. Within the FTP section of this frame, select Request arg, and then choose Colorize with Filter.
Once the necessary adjustments have been made, you'll see the following result.
Keep these tips in mind: choose eye-catching, unused color combinations, and always use uppercase letters for your custom coloring rules.
# 5 Tables and graphs
5.1 Who is communicating with whom?
The Conversations window provides a clear view of which hosts are communicating and the protocols they are using.
It allows us to easily identify the top talkers, and by integrating GeoIP databases, we gain a clear overview of external traffic.
An exercise will be used to help clarify certain concepts.
The following file will be used: tables.pcapng (opens new window)
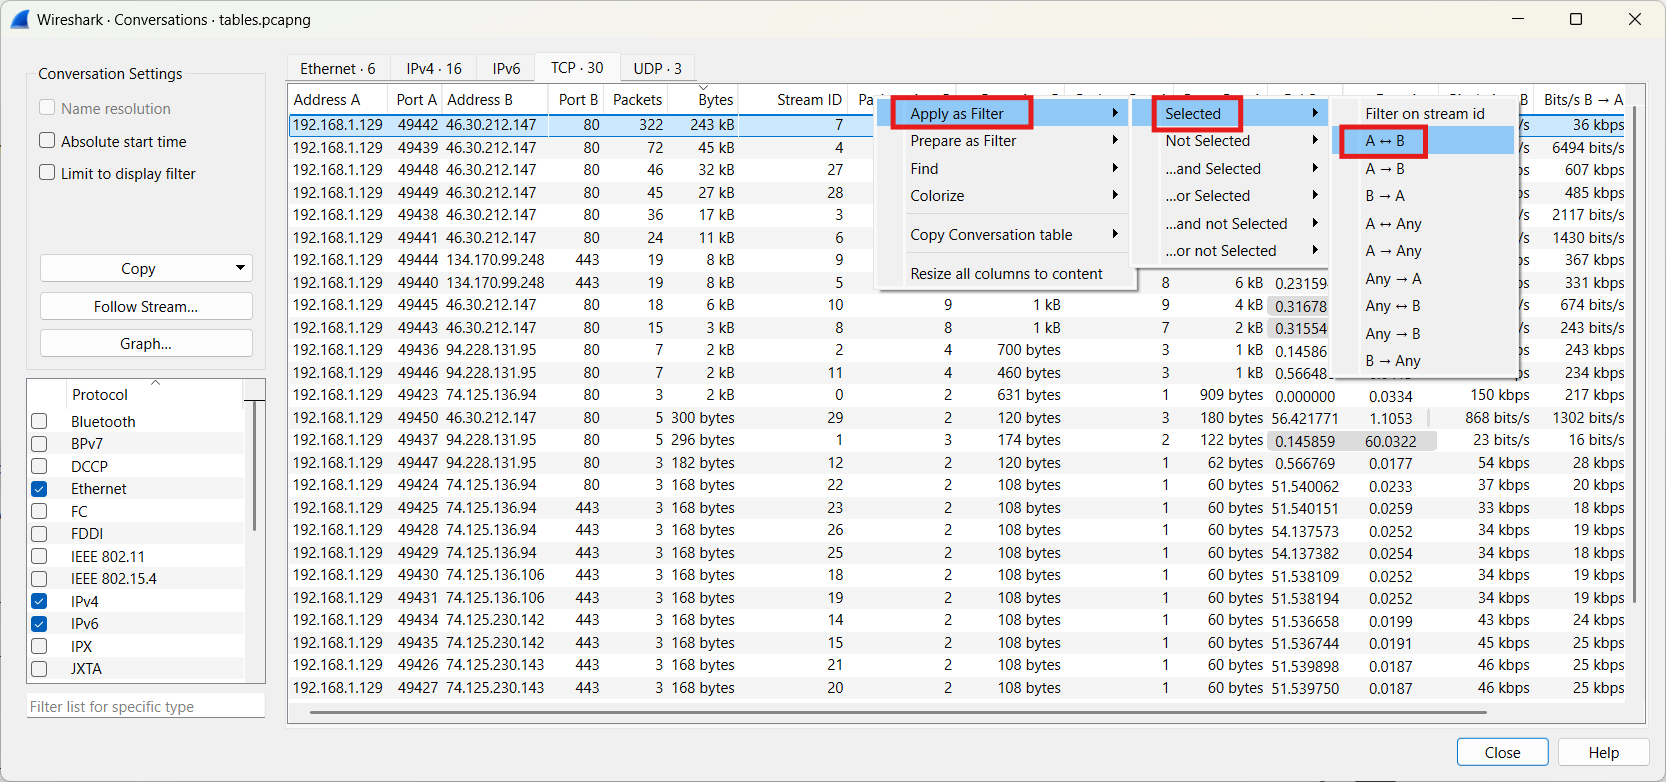
We are looking for the most active conversation. For this, we use Statistics → Conversations.
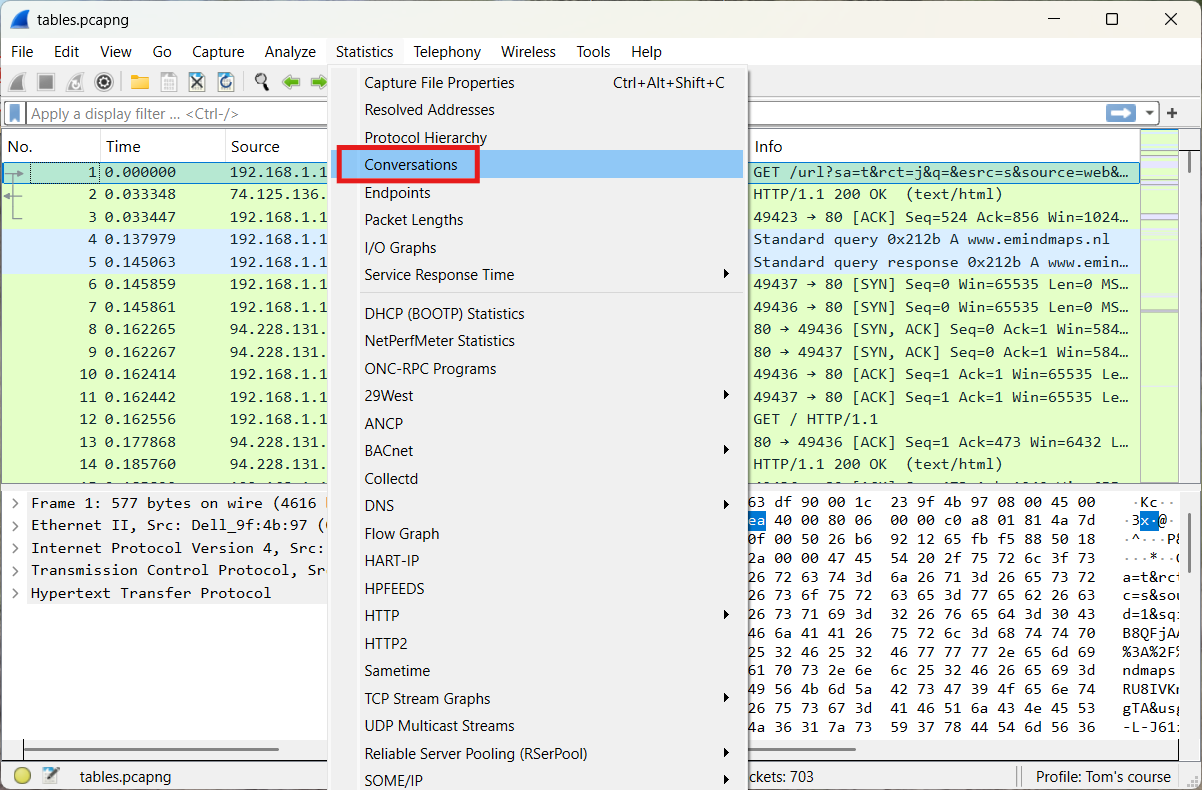
We obtain the following result. We select the TCP tab and sort by the Bytes column.
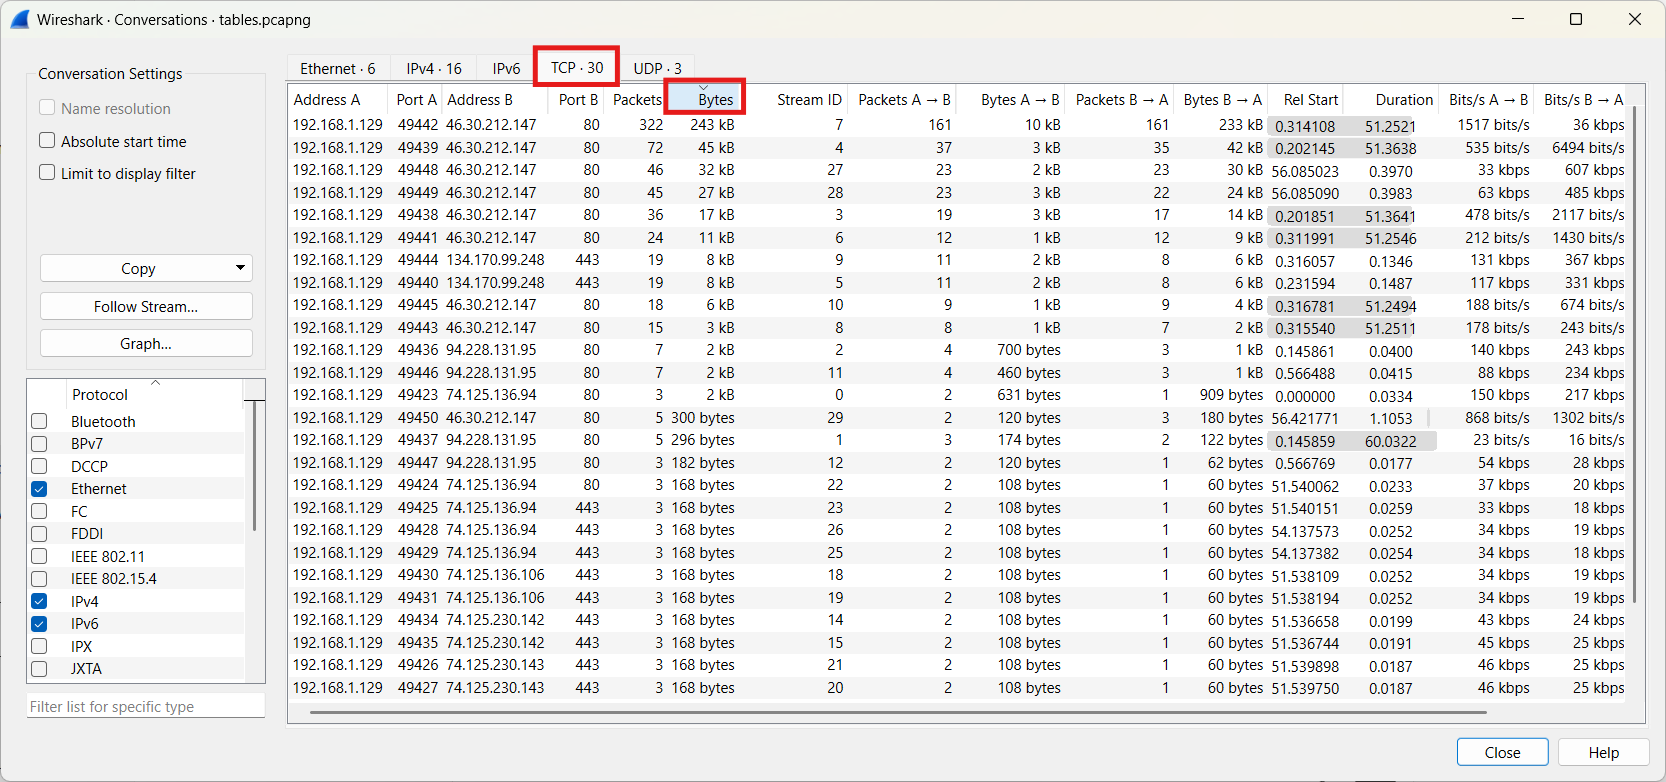
Of course, we can now filter out a conversation to inspect it more closely.
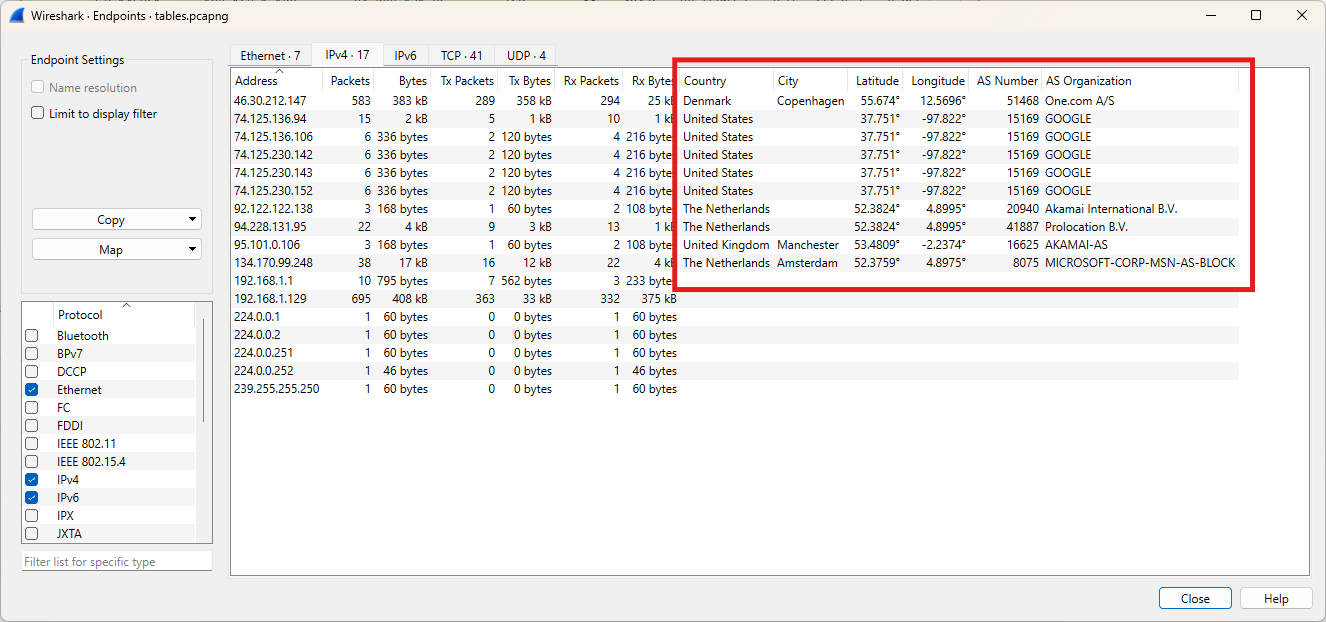
Wireshark can also utilize MaxMind GeoLite databases to map IPv4 and IPv6 addresses to geographic locations around the world.
More information about downloading these GeoLite databases can be found on the following website (opens new window) .
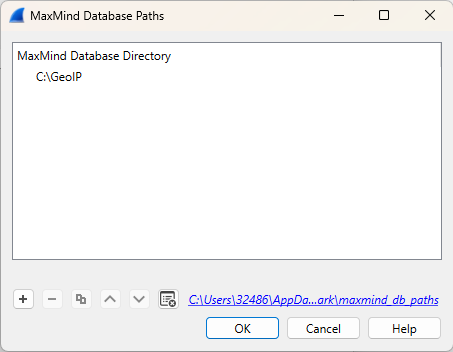
Extract all files and place the files in a folder for example: C:\GeoIP.
Then add some settings in WireShark. Edit → Preferences → Name Resolution → MaxMind database directories → Edit.
Now select Statistics ‐ Endpoints and then select the IPv4 tab.
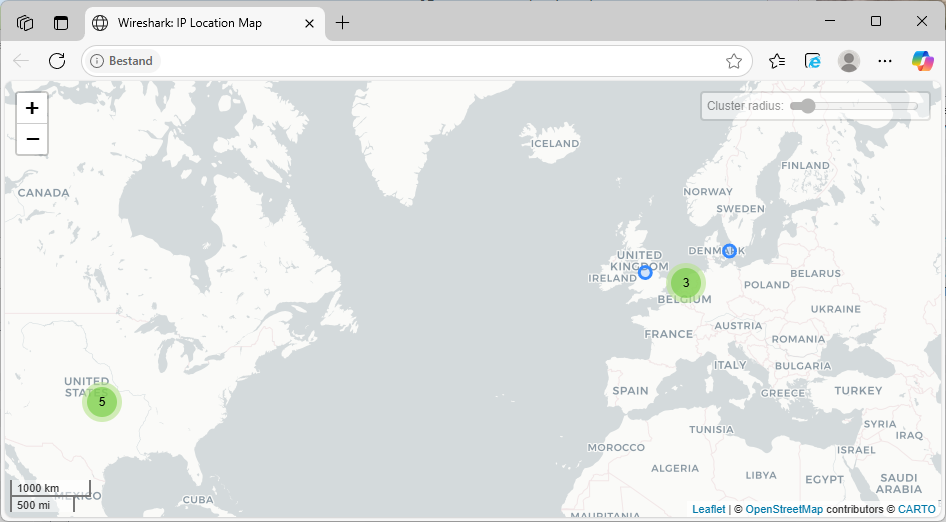
Now select Map and get an overview of all external locations.
5.2 Summary of network protocols operating on your network.
To quickly gain insight into a network capture, using Protocol Hierarchy Statistics is a good starting point. Statistics → Protocol Hierarchy reveals the full range of protocols and applications used in the captured network traffic.
The following file will be used: tables.pcapng (opens new window)
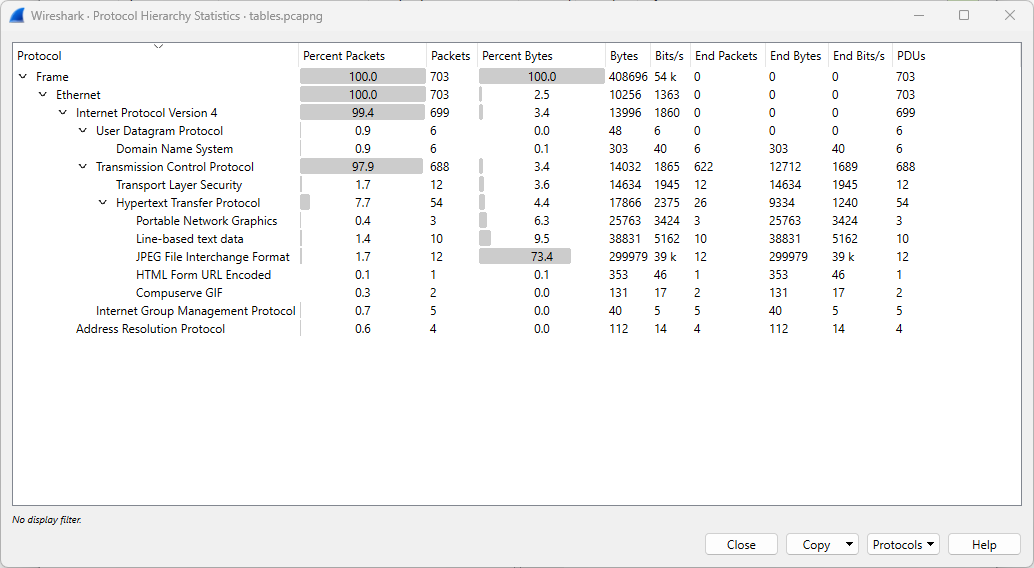
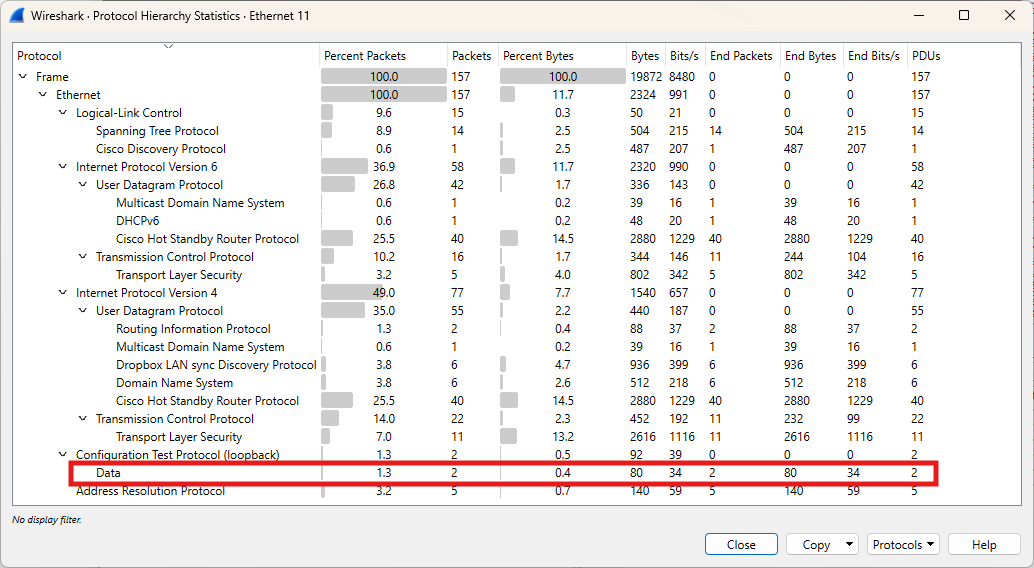
Sometimes, Data appears in the Protocol Hierarchy Statistics overview. Data usually means Uninterpreted or Unknown Protocol.
The most frequent causes are:
- The traffic is encapsulated in a protocol Wireshark can’t fully dissect.
- The traffic could be encrypted, proprietary, or non-standard.
- It might be a payload of a higher-level protocol that Wireshark doesn't decode by default.
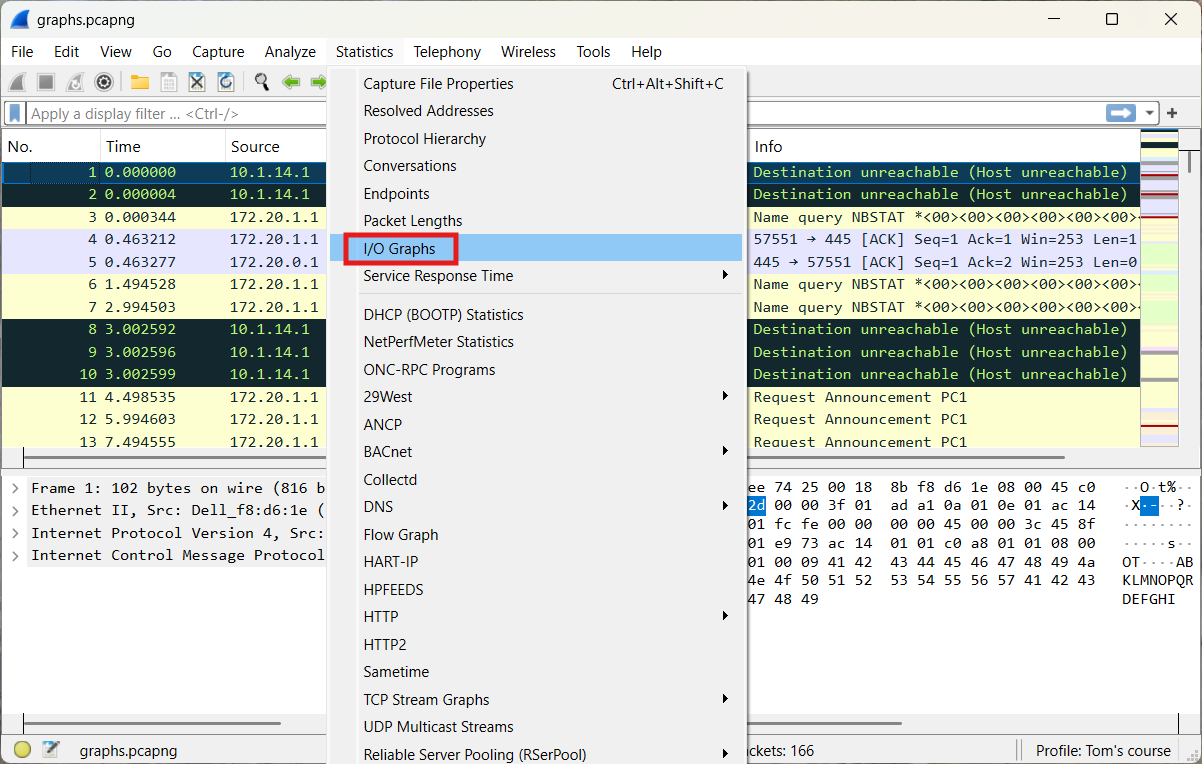
5.3 Graph-based data visualization
Graphs help us analyze certain things more easily.
An exercise will be used to help clarify certain concepts.
The following file will be used: graphs.pcapng (opens new window)
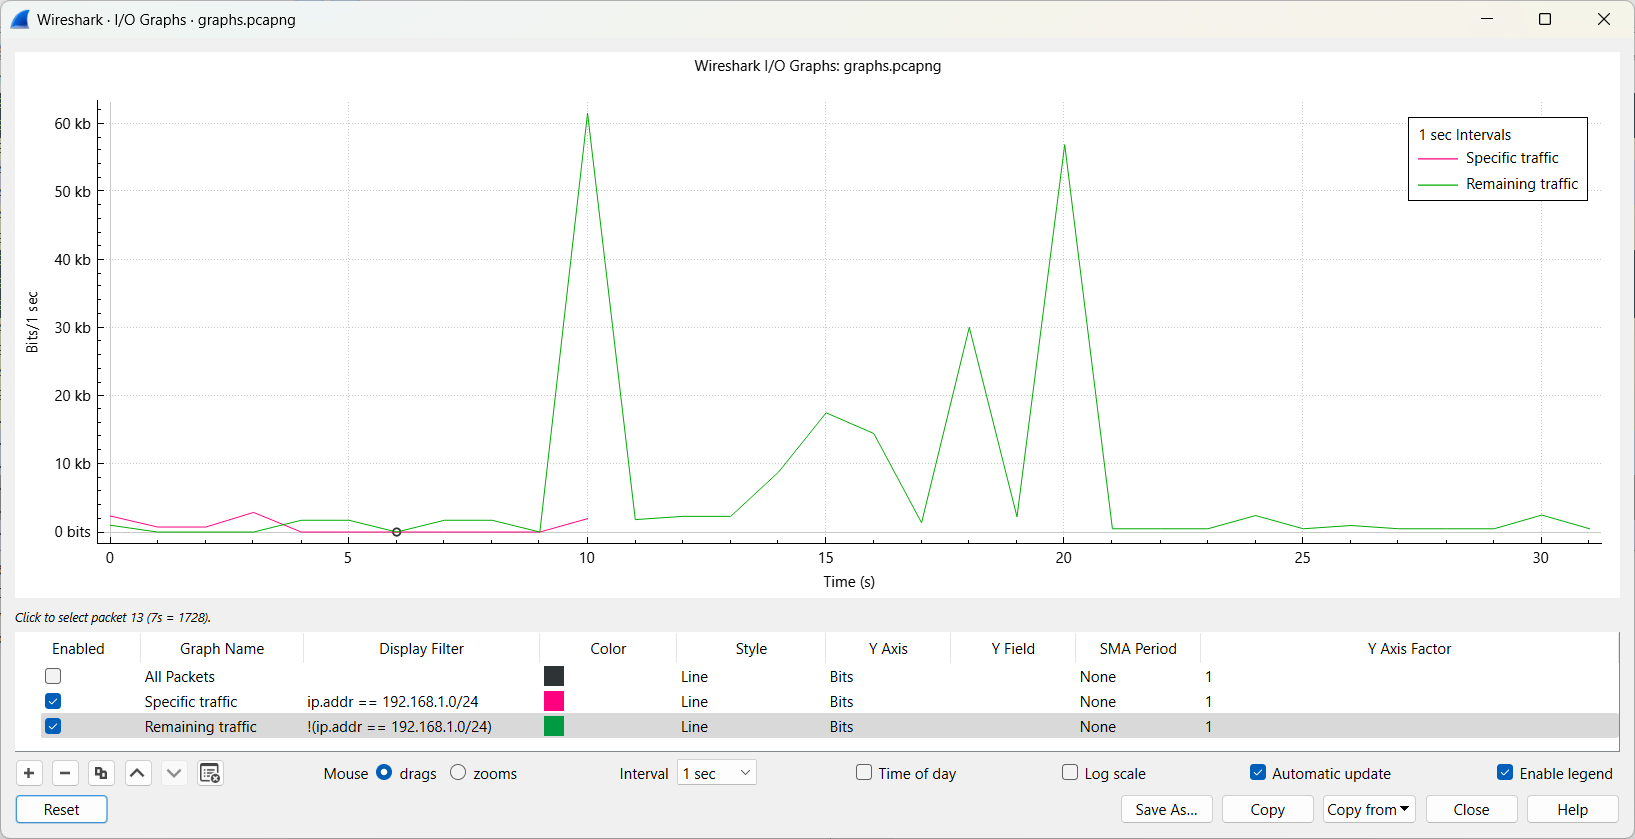
A graph will be created to represent the traffic to and from 192.168.1.0/24, as well as the remaining traffic.
After entering the necessary display filters, adjusting the Y-axis to bits, and making a few style modifications, we obtain the following result.
5.4 Spot possible faults
An interesting tool is the Expert Information.
The following file will be used: delay.pcapng (opens new window)
The circle in the lower left corner provides quick access to this tool. The color of the circle already indicates the severity of the detected events.

Click on the circle to get an overview of the events.
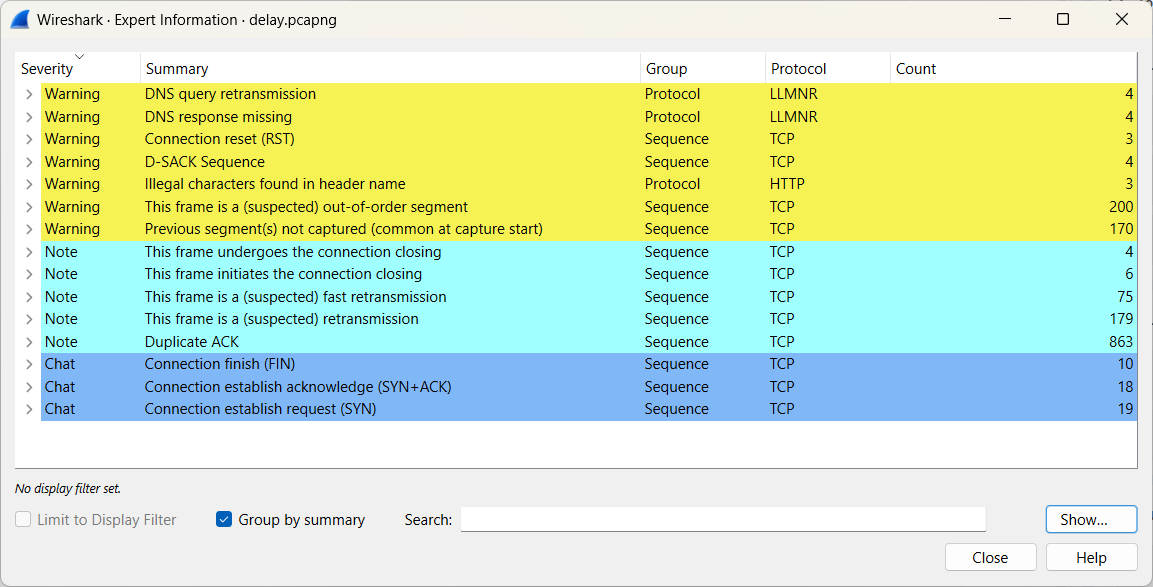
As you can see, Wireshark can detect various network issues, but determining the root cause and potential impact is a different matter altogether. Use appropriate resources to gather more information.
An exercise will be used to help clarify certain concepts.
The following file will be used: download.pcapng (opens new window)
The user is complaining about poor network performance. By using Expert Information, we will investigate the cause.
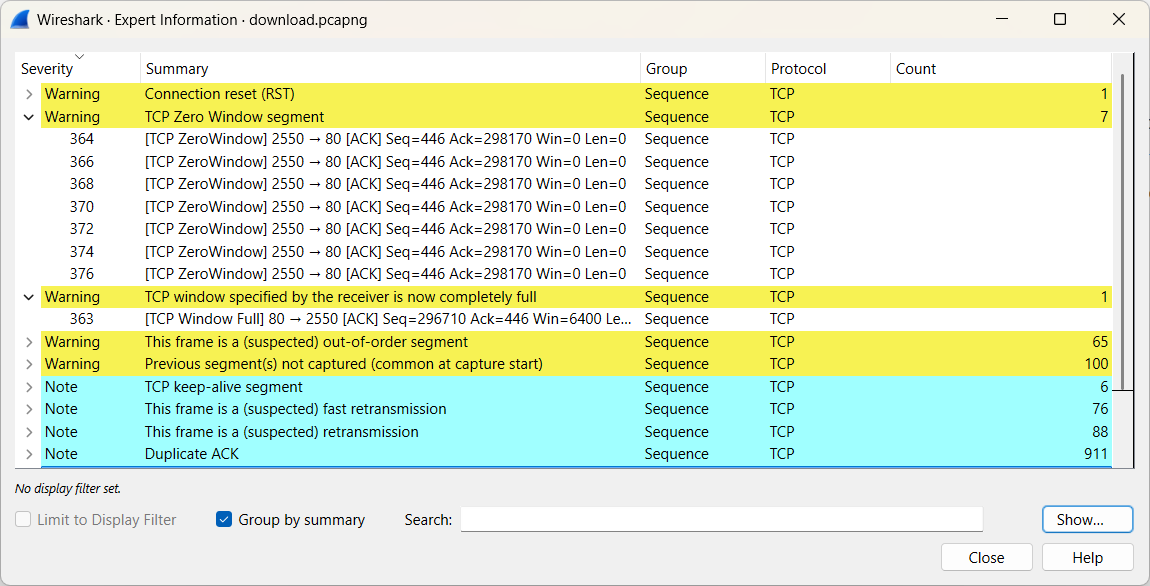
Among the warnings, we find TCP Window Full and TCP Zero Window Segment. Frame 363 and subsequent frames indicate the point at which the root cause emerges.
After consulting the appropriate frames, we determine that the client is overloaded at that specific moment (it has run out of receive buffer space).
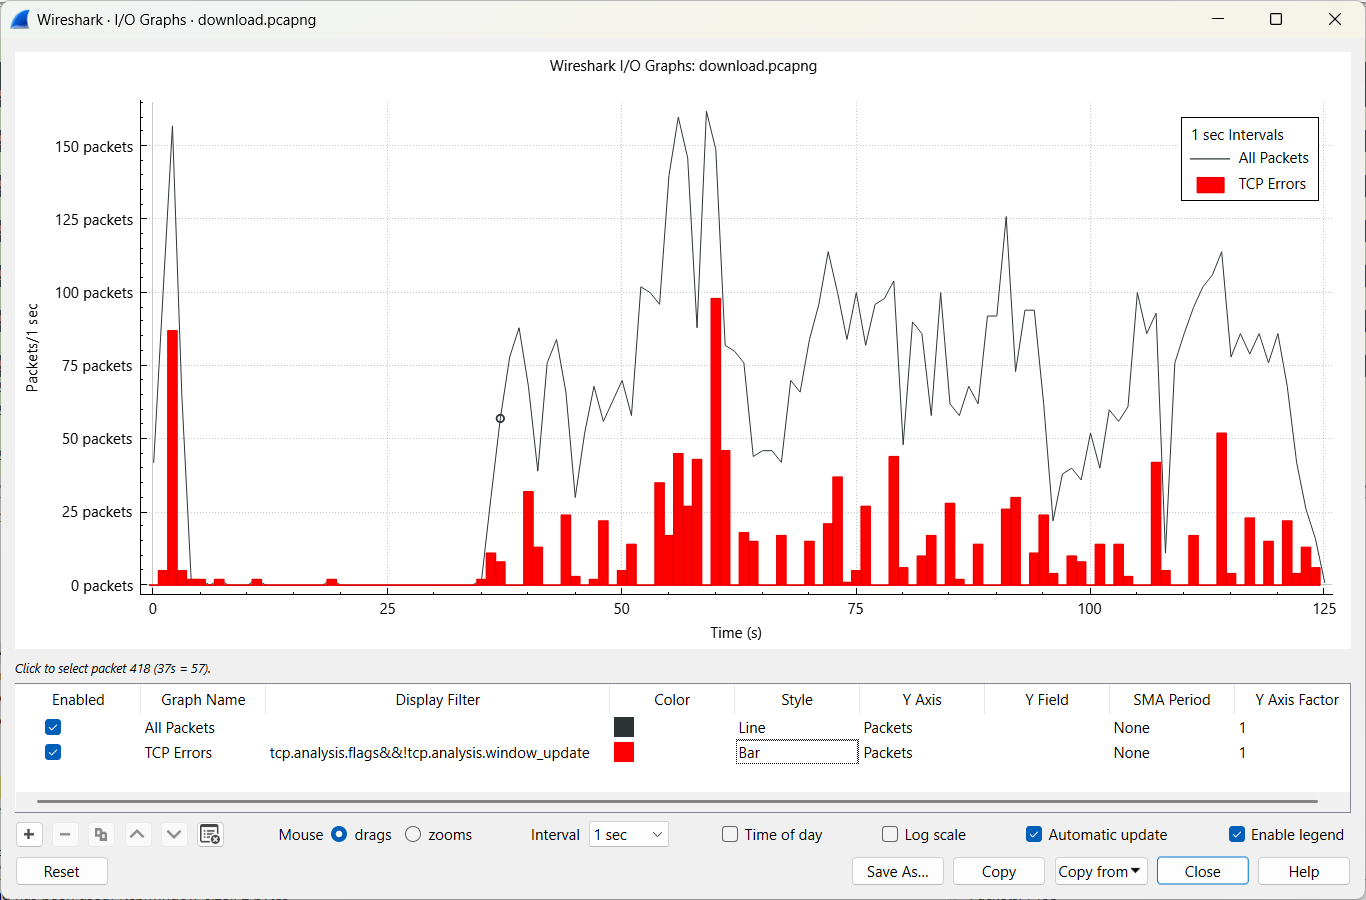
When Wireshark detects network issues, it marks the relevant packets with tcp.analysis.flags.
(Note: TCP Window Update can also be benign and should therefore be filtered out.)
A clear graphical representation that illustrates the situation well can be found below.
# 6 Extract data out of network traffic
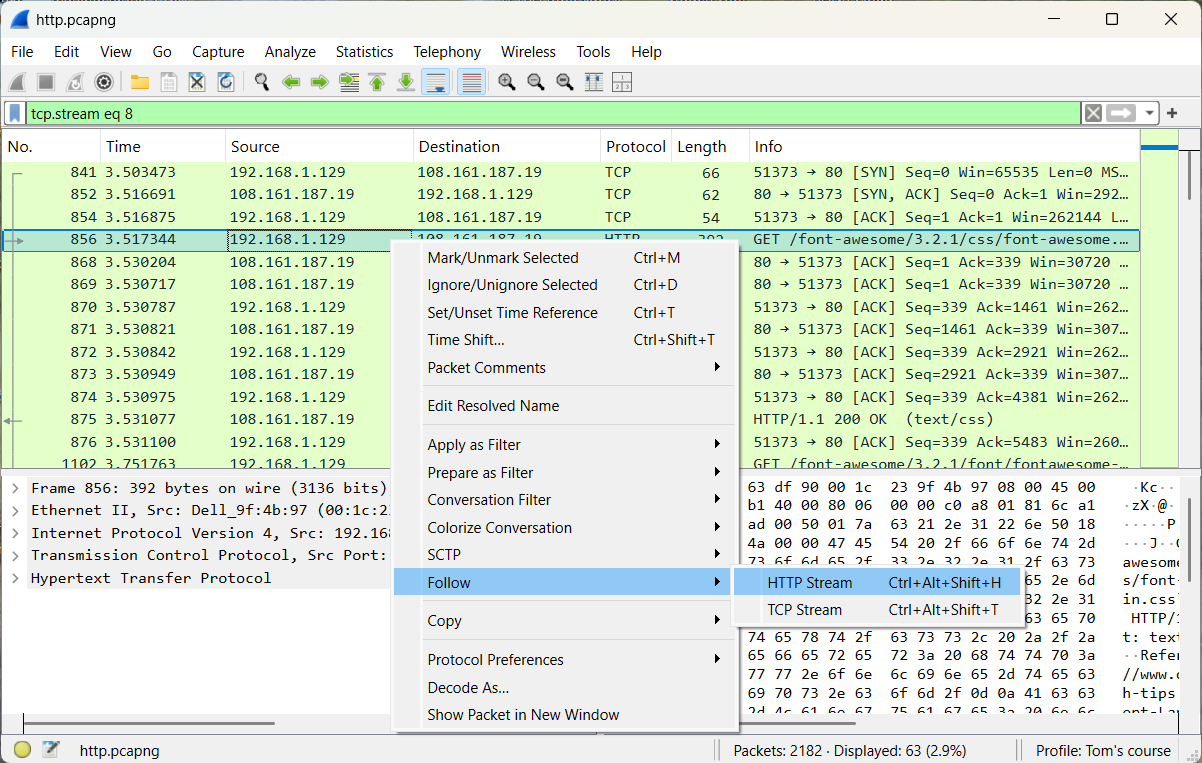
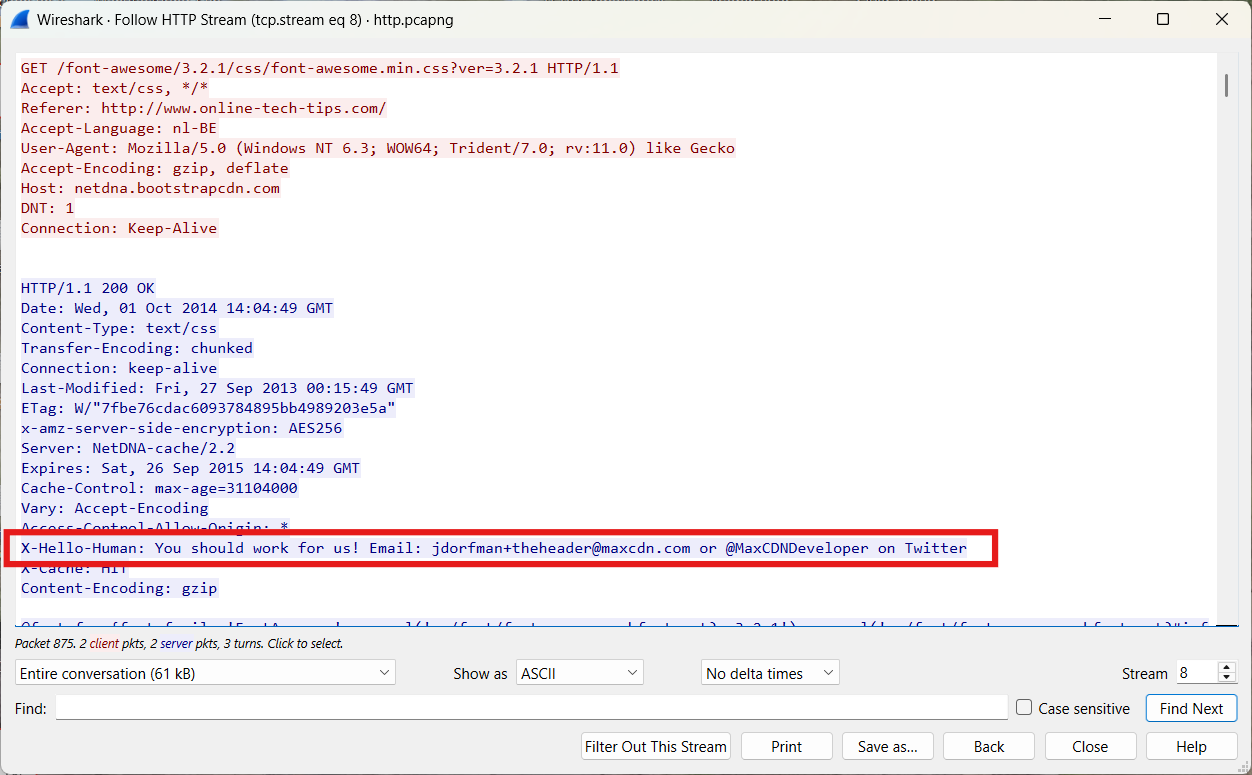
6.1 Reassemble an HTTP stream
An exercise will be used to help clarify certain concepts.
The following file will be used: http.pcapng (opens new window)
The website www.online-tech-tips.com contains hidden messages. Who can find them?
We select frame 856 and perform Follow HTTP Stream.
Of course, HTTP is no longer widely used on the Internet. Contemporary standards such as HTTPS and QUIC have become predominant.
However, both protocols employ encryption, rendering their contents inaccessible through conventional inspection methods.
In a subsequent chapter, we will explore potential approaches for decrypting HTTPS and QUIC traffic in order to retrieve human-readable data.
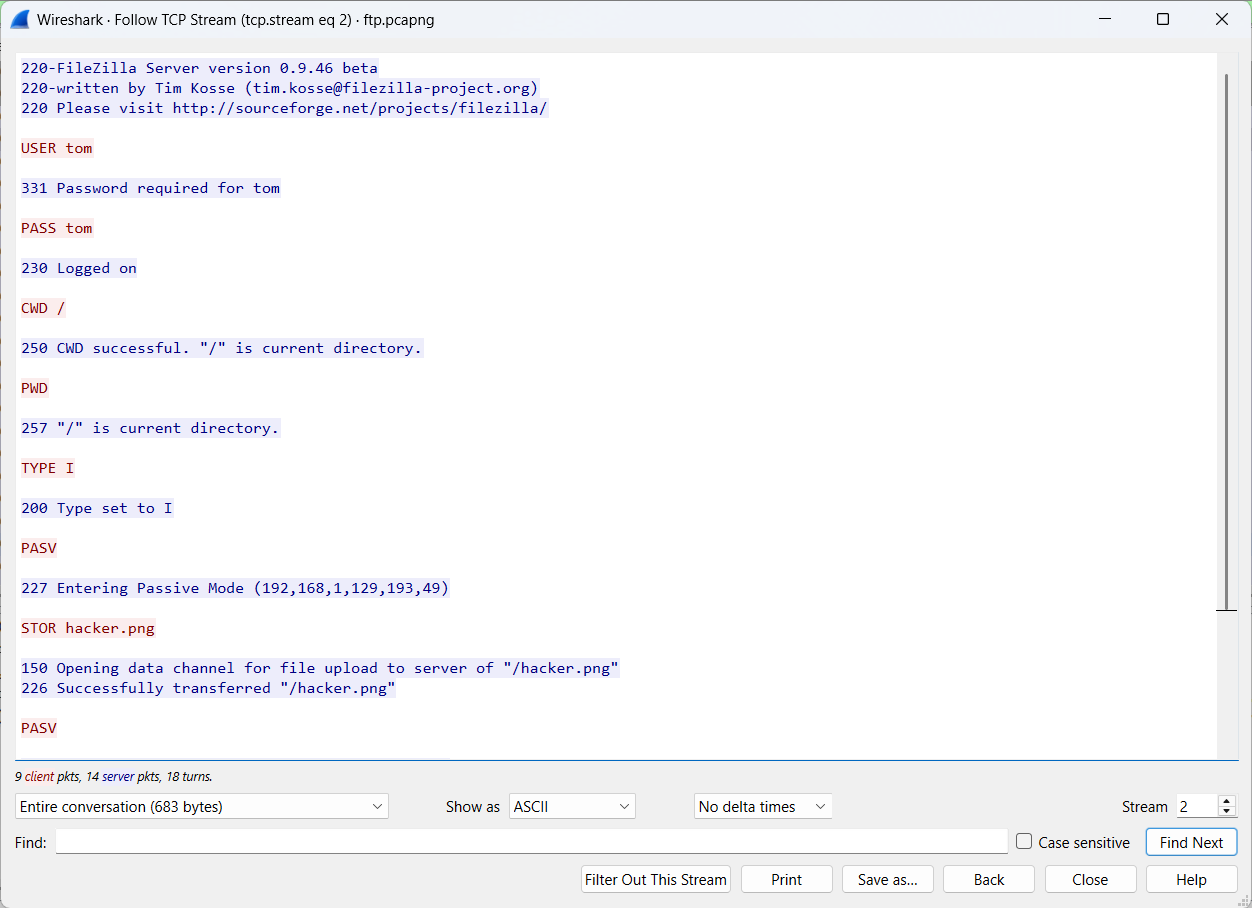
6.2 Extract files out of an FTP stream
An exercise will be used to help clarify certain concepts.
The following file will be used: ftp.pcapng (opens new window)
Select frame 45 and perform Follow TCP Stream. The main goal is to recover the file hacker.png.
The session consists of two parts: the login phase and a file transfer.
Select frame 66 and perform Follow TCP Stream. The file signature (magic bytes) corresponding to a PNG format becomes clearly visible.
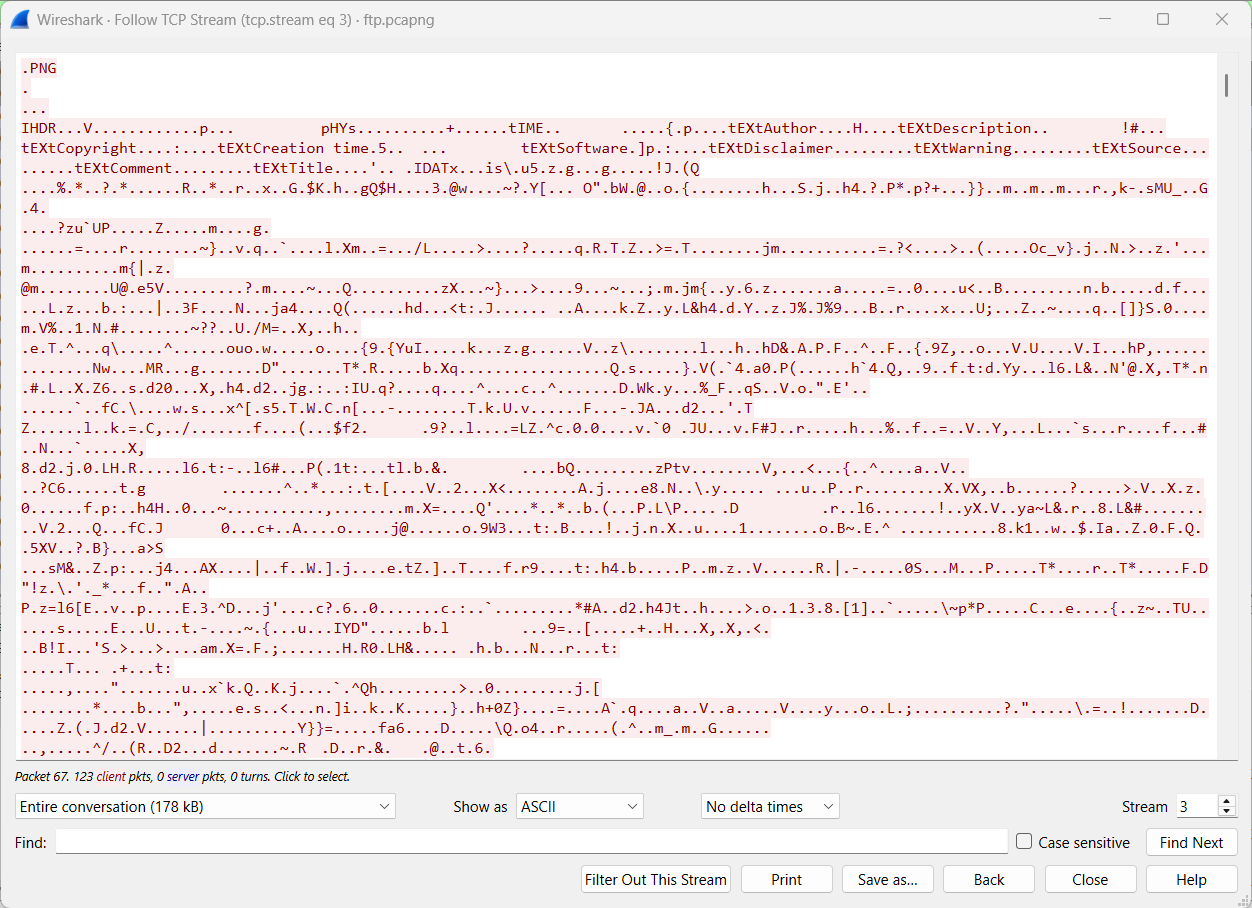
Change the field Show asto Raw, then select Save As and name the file hacker.png. Finally, open the image to view it.

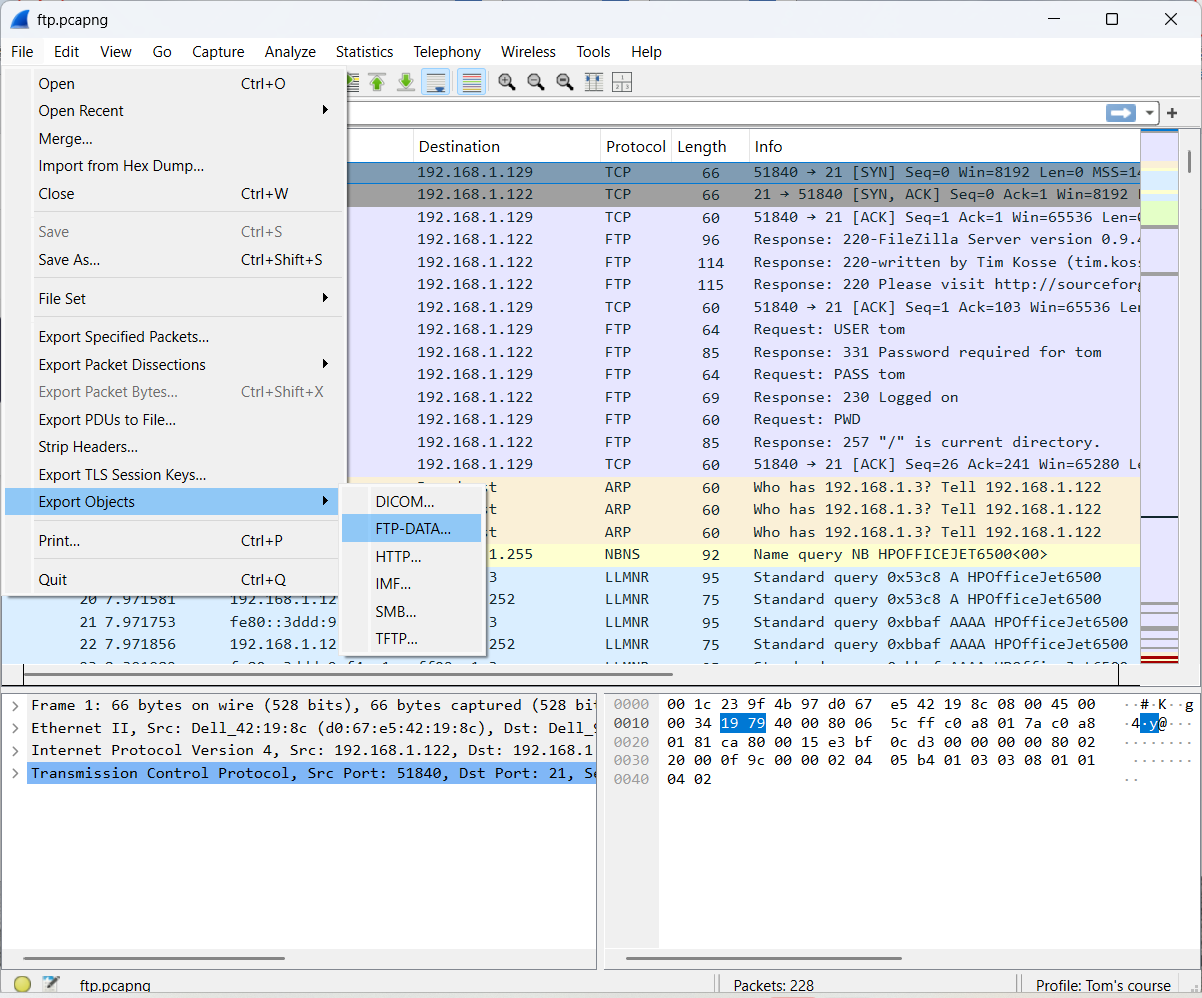
You can also use File → Export Objects → FTP-DATA as a faster alternative.
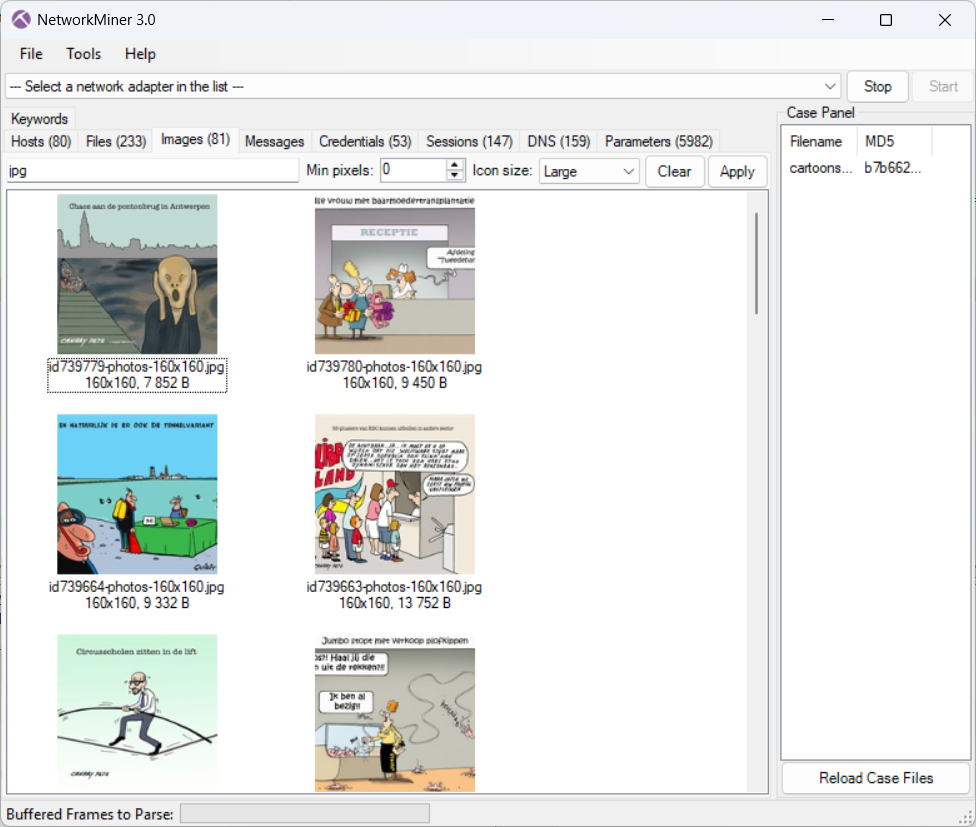
6.3 Extract images out of a stream
In the subsequent exercise cartoons.pcapng (opens new window), the objective is to visualize all photographs and figures accessed by a user on a website. While this task could be performed manually, the use of the application NetworkMiner (Free Edition) (opens new window) constitutes a more efficient and appropriate solution.
Question:
How many JPEG files can be extracted?
A screenshot of the NetworkMiner application is shown below.
6.4 Extract video out of a stream
In the subsequent exercise video.pcapng (opens new window), the objective is to visualize the video stream.
Question:
Which message is displayed in the video stream?
As this exercise is not trivial, the methodology is outlined below.
- Step 1: Find the video stream in the network traffic. (Identify streams that consume high amounts of bandwidth)
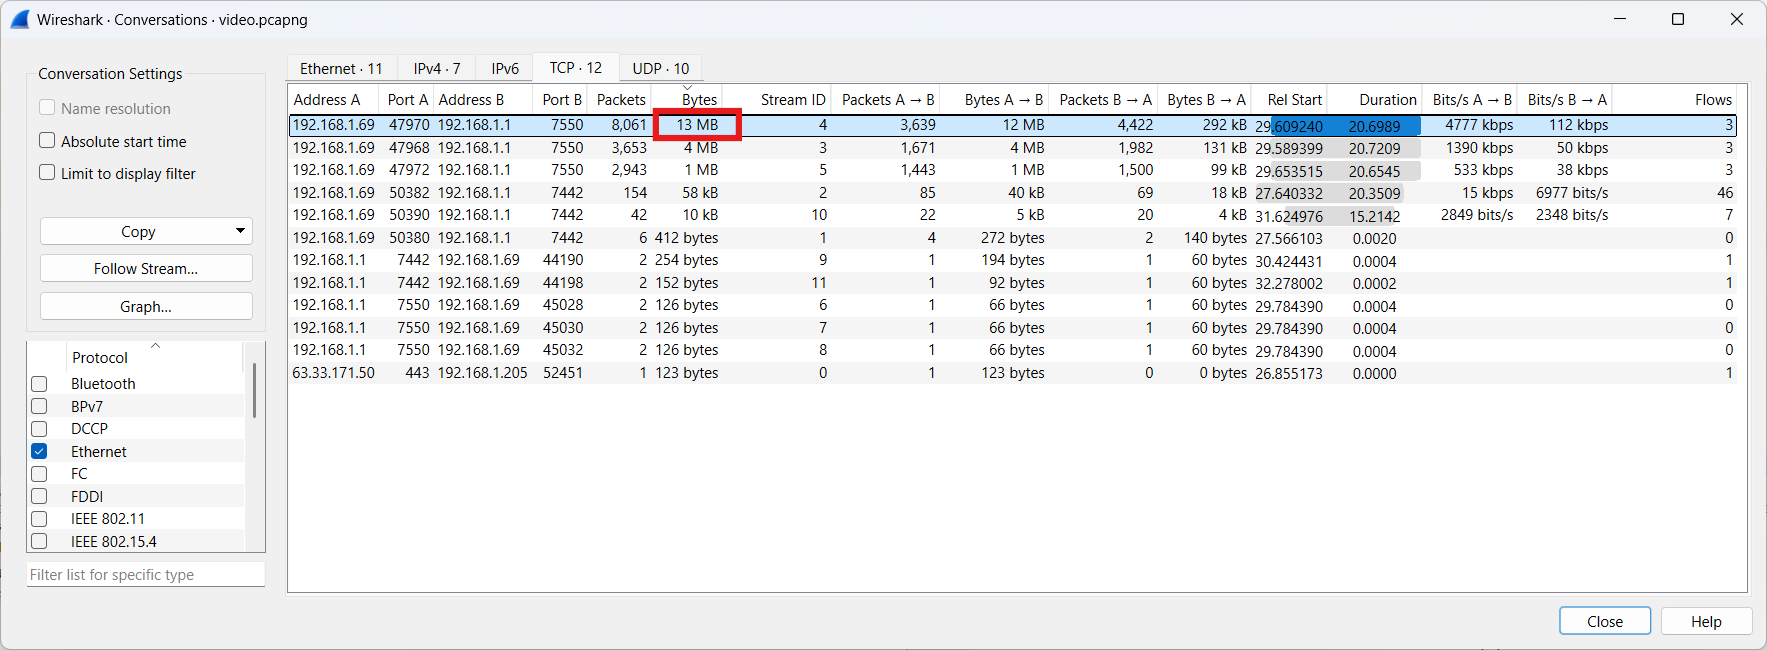
- Step 2: Apply a filter to the video stream and present it visually.
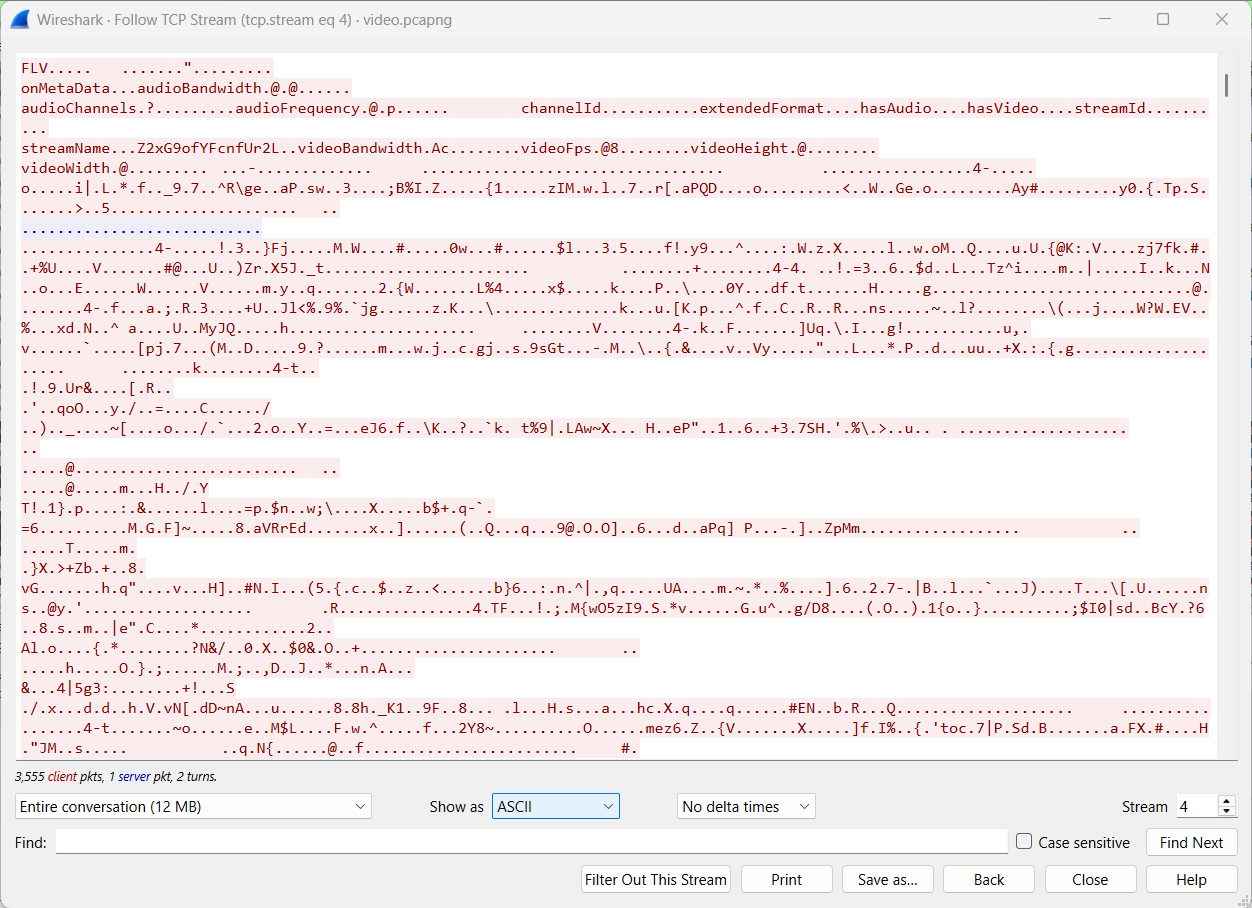
Step 3: Identify the video stream using the magic bytes (FLV). This is clearly the Flash video format.
Step 4: Extract the video stream and save it as video.flv.
Step 5: Open the file with a media player; unfortunately, playback is unsuccessful.
Step 6: To repair the video file, utilize a specialized tool like Stellar Repair for Video.
Step 7: Open the repaired file with a media player.
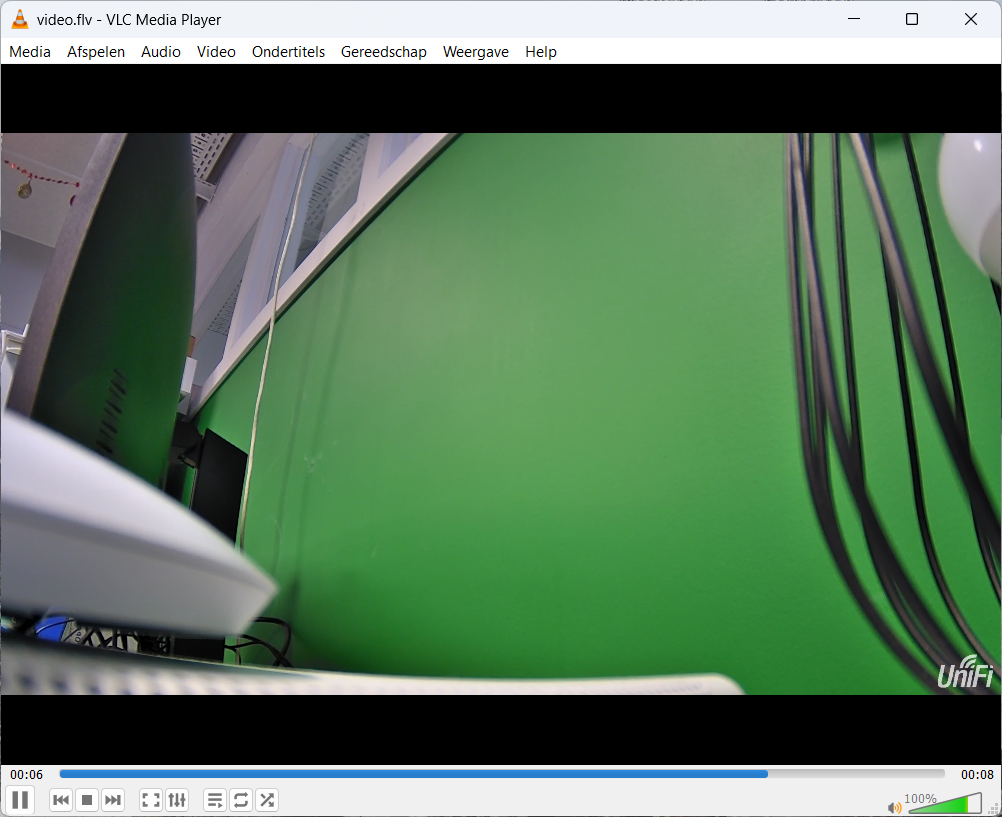
FYI: The message can be found in a different conversation.
# 7 Straight from practice
7.1 Decryption of TLS sessions
In computer networks, communication between clients and servers is frequently encrypted. For instance, the HTTP protocol is now almost exclusively employed in its secure variant, HTTPS, for interactions with web servers.
This development has significant implications for the analysis of network traffic. Nevertheless, techniques are available to decrypt HTTPS traffic.
The following section provides a overview of the approach applied within Wireshark.
Step 1: Completely close the Google Chrome web browser.
Step 2: Launch Wireshark, choose the appropriate network interface, and begin capturing traffic.
Step 3: Select
Tools→TLS Keylog Launcher
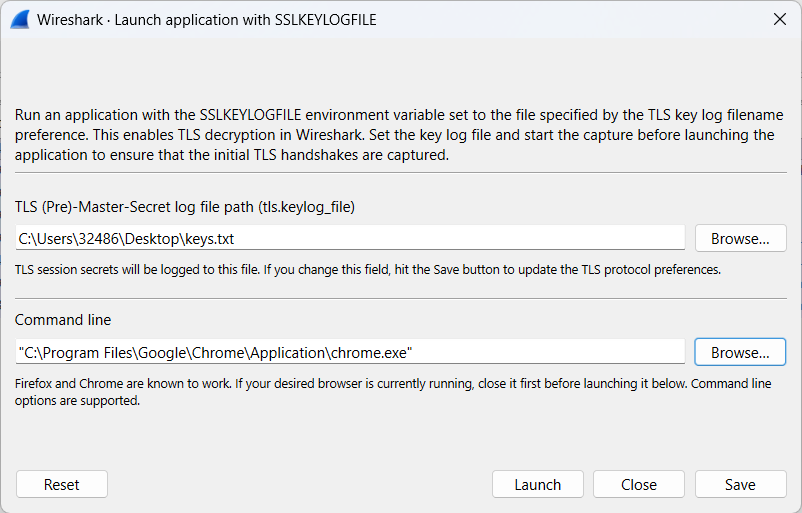
The path for the initial file can be defined by the user.
The file path associated with Google Chrome is dependent on the specific system configuration.
- Step 4: Click
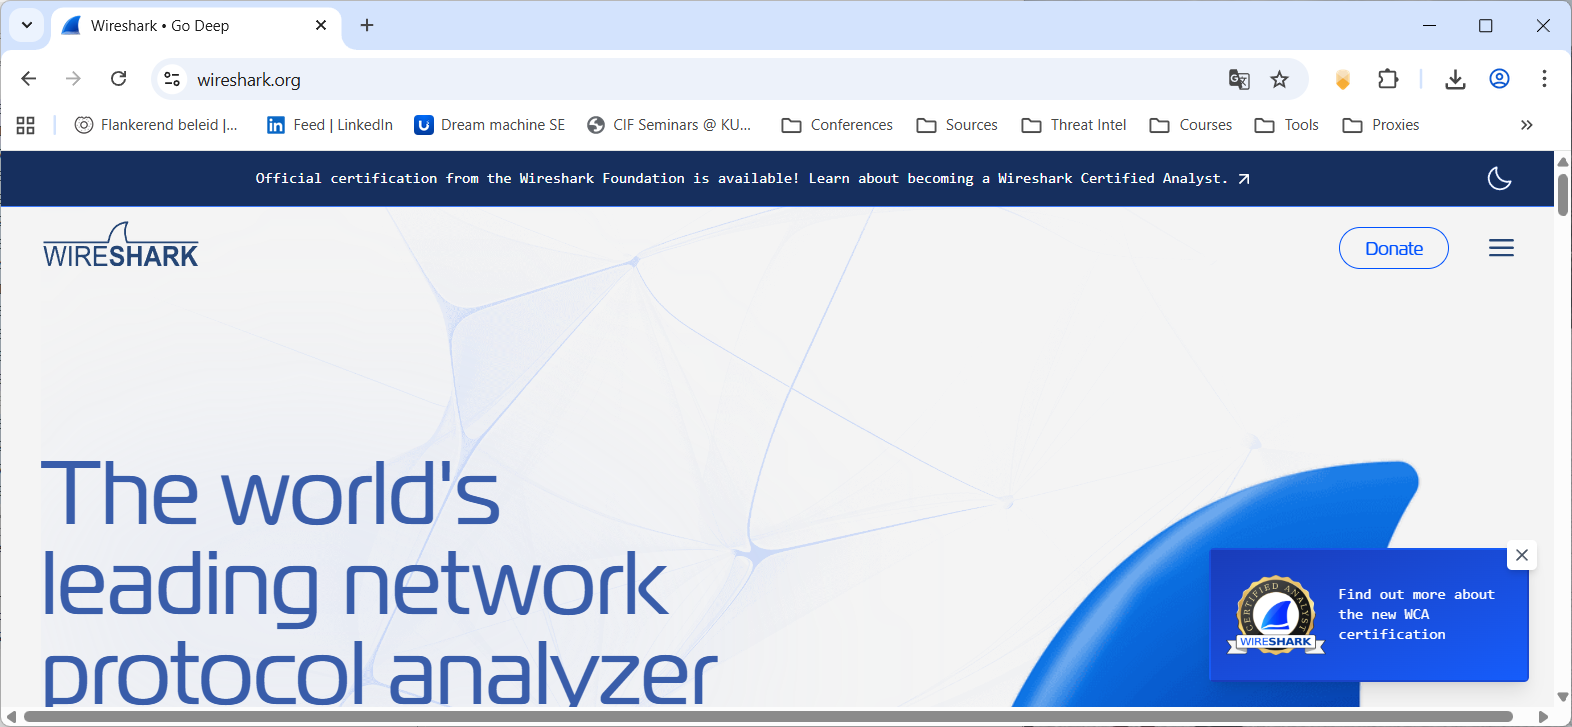
Launchto open the web browser, then start using it. For example, navigate to the Wireshark website.
Step 5: Shut down the web browser and terminate the capture.
Step 6: Look for the communication between your client and Wireshark’s web server.
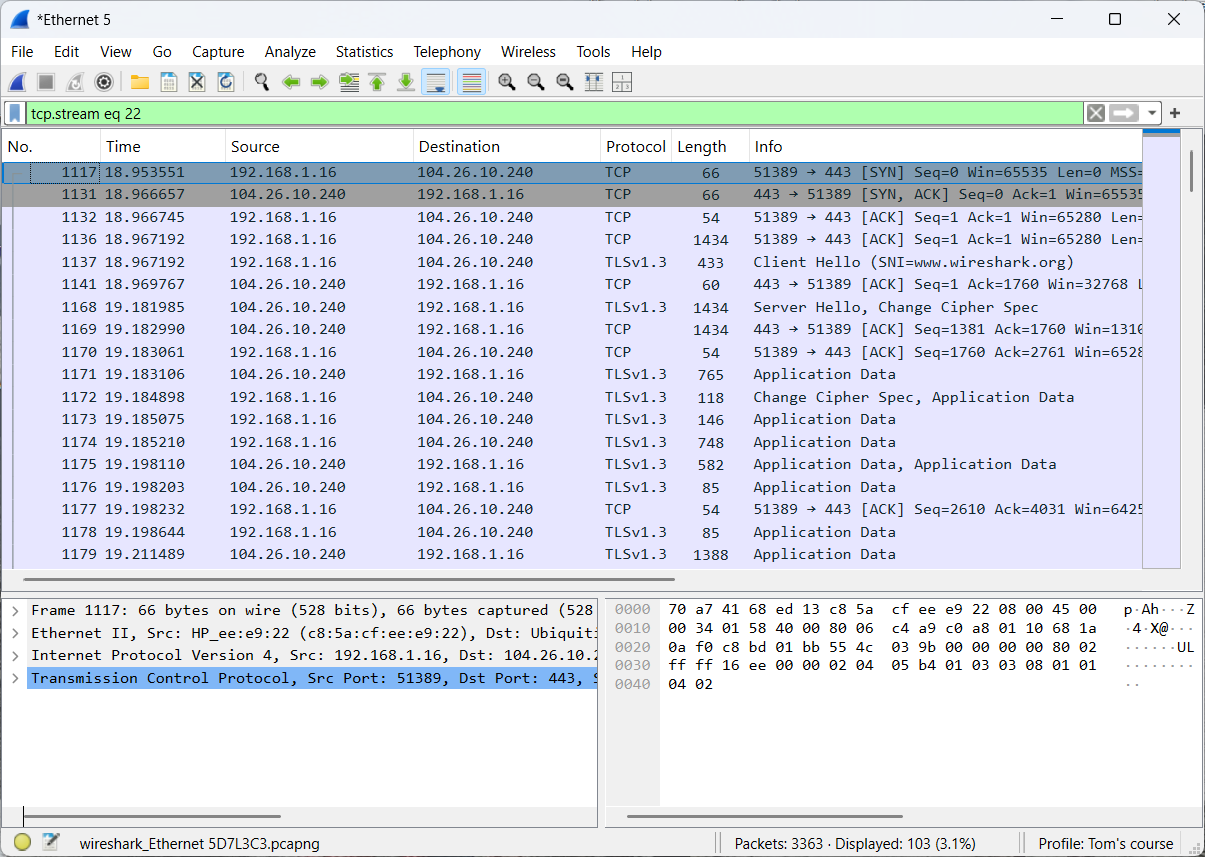
The observed network traffic remains encrypted.
- Step 7: Select
Edit→Preferences→Protocols→TLS→(Pre)-Master-Secret log filename Browse
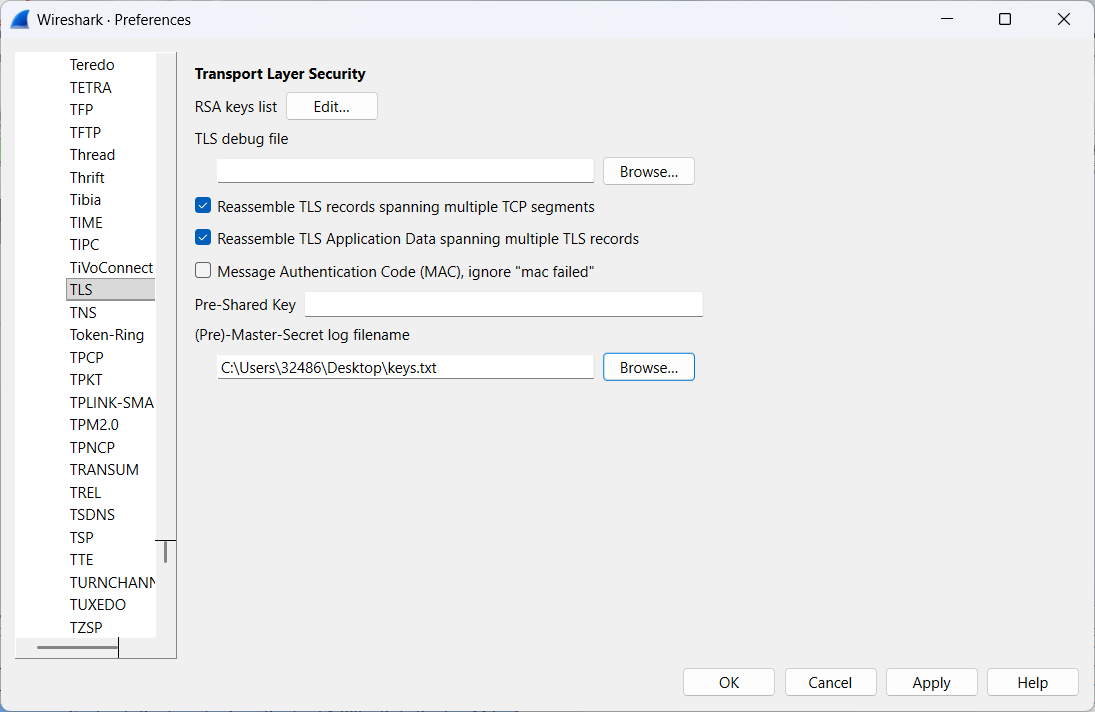
- Step 8: Re-examine the communication between your client and Wireshark's web server.
The network traffic is no longer encrypted!!!
- Step 9: Inject the secrets into the capture file. (Optional)
To decrypt the traffic, you currently need both the keys.txt file and the capture file, which is not very convenient. It’s better to inject the secrets directly into your capture file.
This can be done easily via Edit → Inject TLS Secrets.
Question:
The Wireshark.org website contains several hidden messages. Can you identify them by analyzing the network traffic?
(Hint: x-slogan)
7.2 The value of baselining
Baselining is the process of capturing network traffic under normal operating conditions. When network issues occur (for example, a security breach), the baseline allows you to more quickly determine whether specific network traffic is abnormal.
In other words, baselining increases both efficiency and effectiveness in troubleshooting.
Key aspects to consider during baselining include:
Broadcast and multicast types
- Who is performing broadcasts/multicasts?
- Which applications are using broadcast/multicast?
- What is the volume of broadcast/multicast traffic (packets per second)?
- …
Protocols and applications
- Which applications/protocols are using the network?
- Which ports are in use (UDP/TCP)?
- Is there ICMP traffic on the network?
- …
Bootup sequences
- How does the DHCP process unfold?
- Which applications generate network traffic during computer startup?
- …
User logon/logoff
- Is there any reconnaissance activity?
- Which servers does the client contact?
- How many packets are transmitted during logon/logoff?
- …
Network traffic in idle state
- Which applications generate traffic while the system is idle?
- Who is being contacted during idle state?
- …
Startup of core Tasks (critical applications)
- Is there any reconnaissance activity?
- Which ports are in use (UDP/TCP)?
- How many packets are transmitted when starting these core tasks?
- Is any sensitive information visible in clear text?
- …
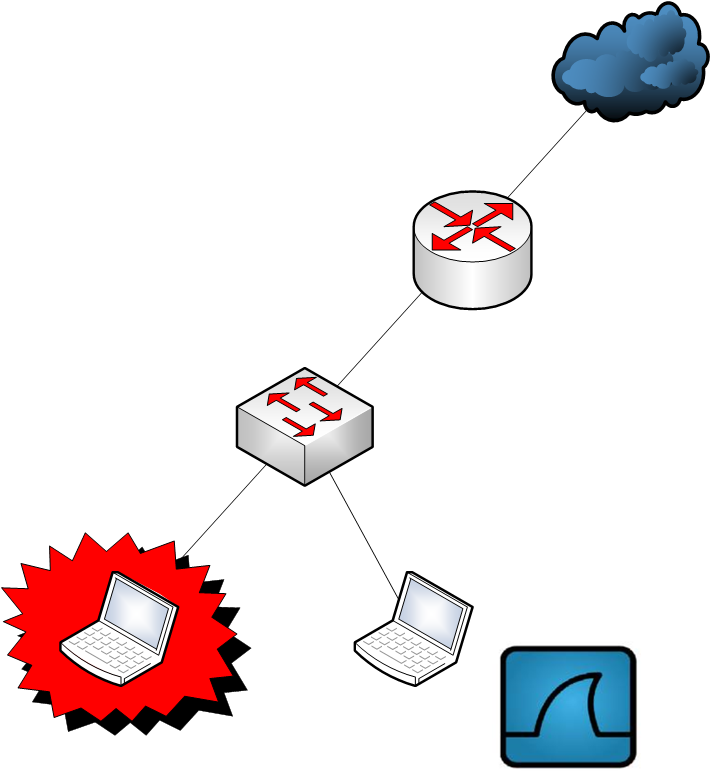
The next exercise will use the topology illustrated below.
A baseline baseline.pcapng (opens new window) is available as a reference.
By configuring port mirroring, the traffic from port Fa0/3 was duplicated onto port Fa0/13.
Question: On PC1, the user experiences a slight performance delay, but overall functionality remains intact. What is the likely cause? File to be used: error1.pcapng (opens new window)
7.3 OT (Operational Technology) networks
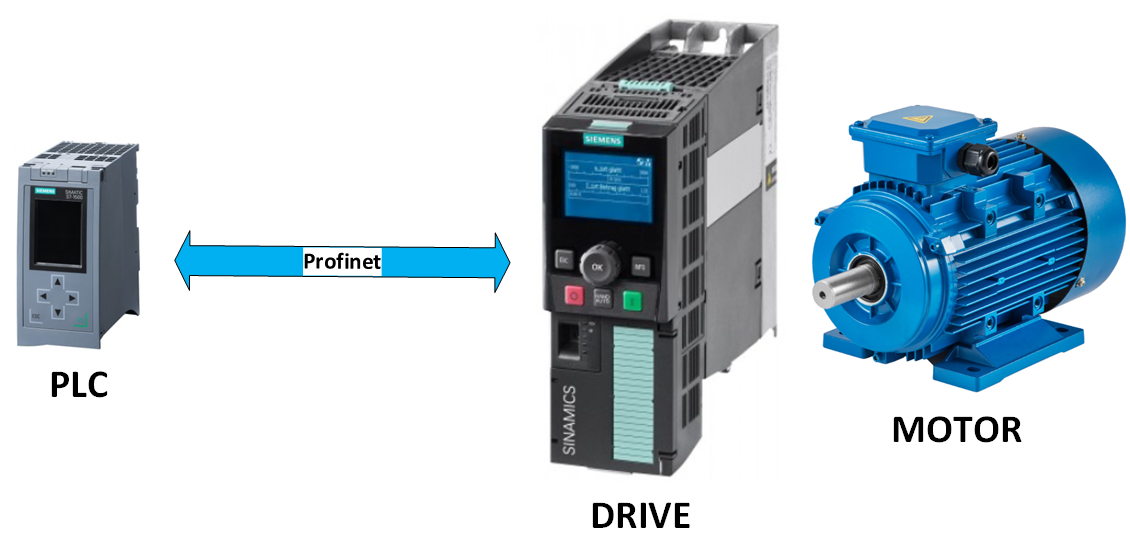
7.3.1 PROFINET
PROFINET (Process Field Network) is an industrial Ethernet standard used for real-time data exchange between controllers (like PLCs) and field devices (like sensors, actuators, and drives) in automation systems.
This communication protocol will be examined through the use of a realistic example.
File to be used: profinet.pcapng (opens new window)
During operation, the PLC and drive continuously exchange data in real-time (RT).
- The PLC sends control data (e.g., start/stop, speed setpoint, direction).
- The drive sends status data (e.g., current speed, torque, fault codes).
These data exchanges occur at deterministic cycle times.
The MAC address of the PLC is 28:63:36:88:08:65 and the MAC address of the drive is 68:3E:02:13:1C:AE .
The communication between the PLC and the drive includes, among other elements, a control word and the speed setpoint.
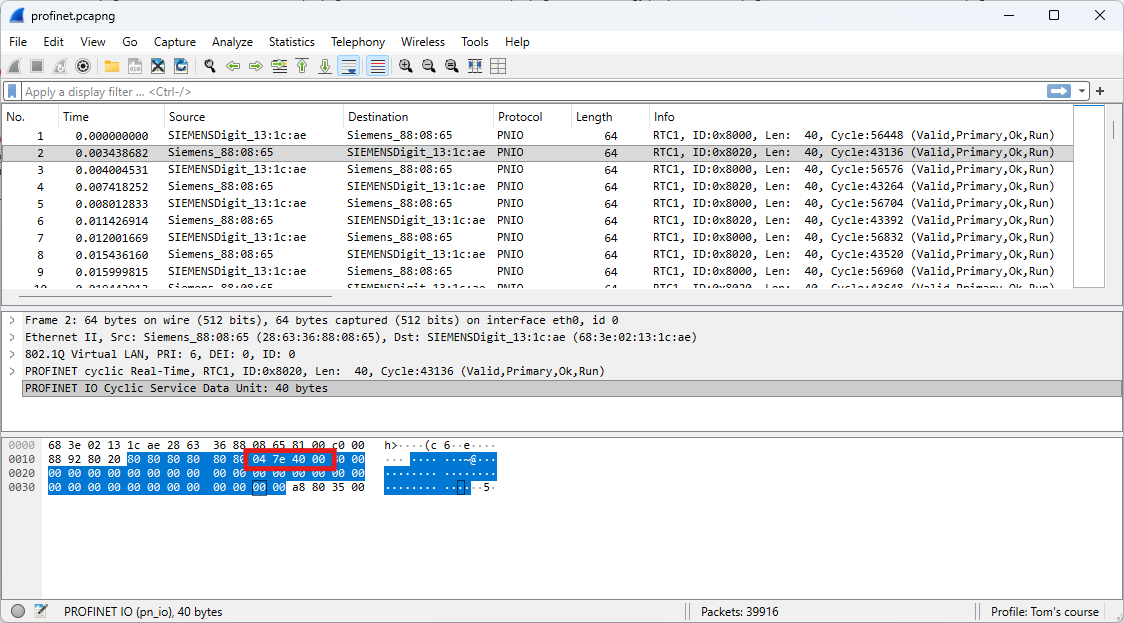
Based on the PLC’s datasheet, the following values can be identified:
- 0x047F: Motor ON
- 0x047E: Motor OFF
- 0x0000: Speed setpoint at 0%
- 0x4000: Speed setpoint at 100%
The communication between the drive and the PLC includes, among other elements, a status word and the actual speed value.
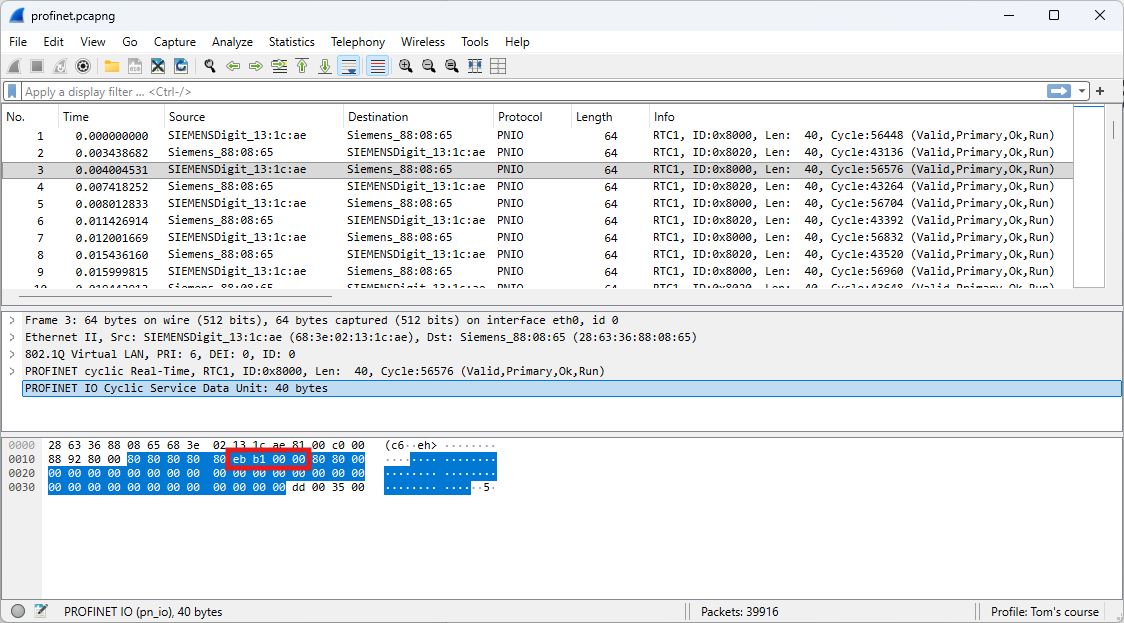
Based on the drive’s datasheet, the following values can be identified:
- 0xEFB7: Motor ON
- 0xEBB1: Motor OFF
- 0x0000: Actual speed is 0% of the maximum
- 0x4000: Actual speed is 100% of the maximum
Question: If the maximum speed is defined as 400 rpm, what is the current speed at frame 4619?
7.3.2 BACnet
BACnet (Building Automation and Control Network) is a communication protocol designed specifically for building automation and control systems. The YABE (Yet Another BACnet Explorer) application will be utilized to generate BACnet communication traffic.
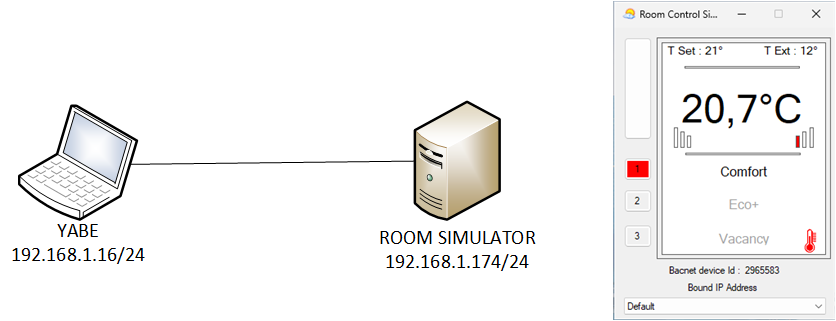
This communication protocol will be examined through the use of previous setup.
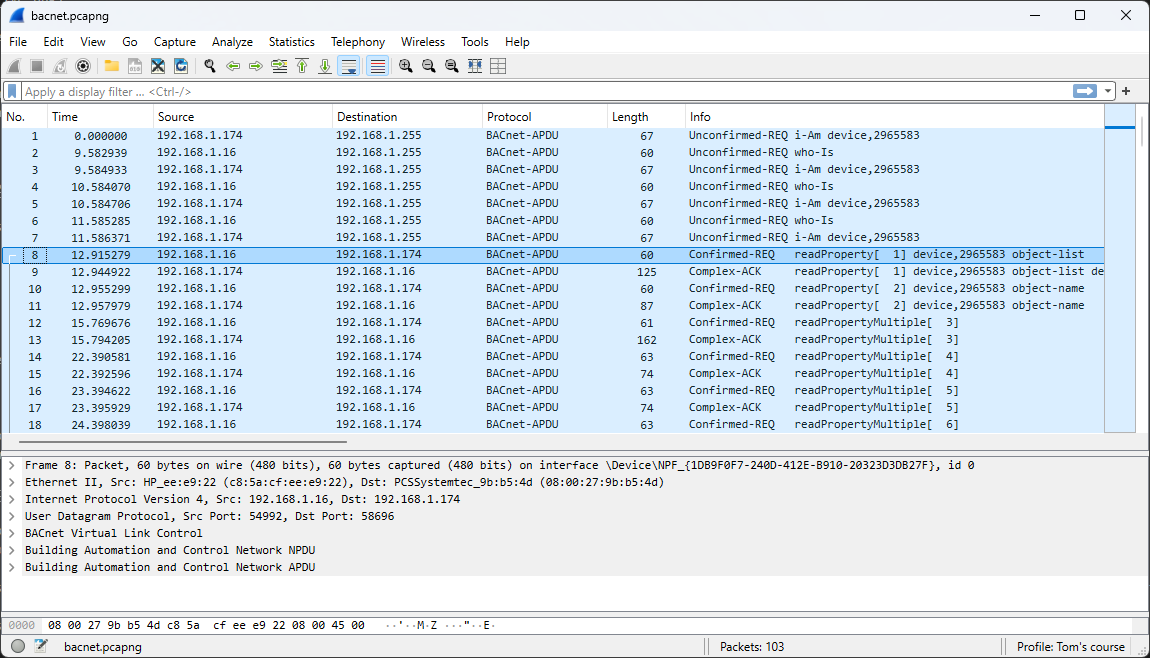
File to be used: bacnet.pcapng (opens new window)
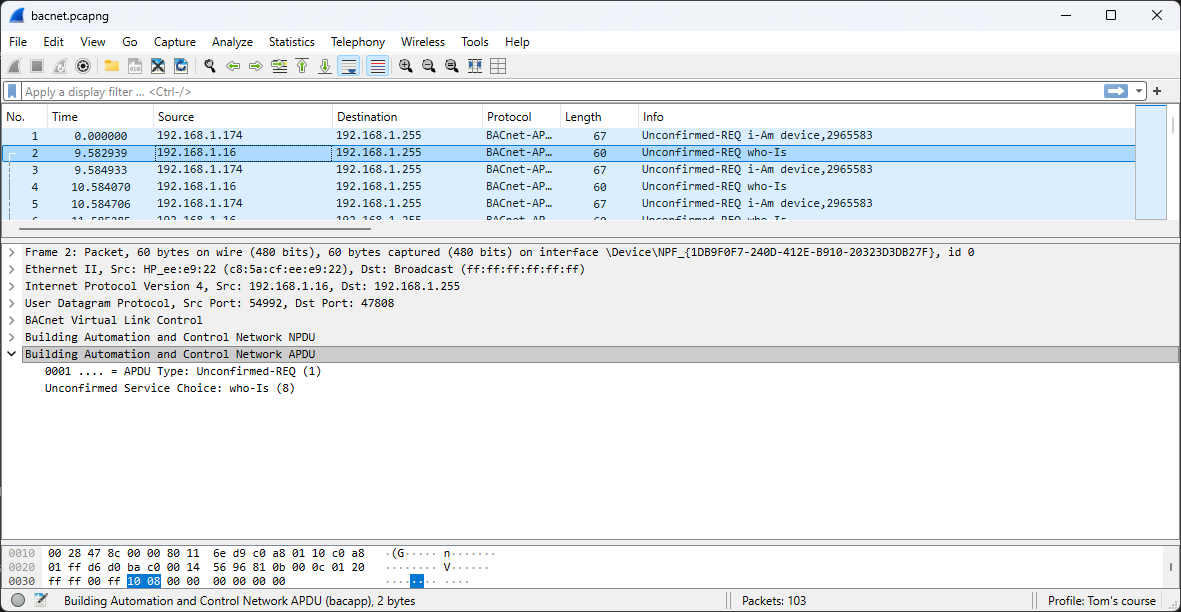
A BACnet Who-Is message is a broadcast request that devices on a BACnet network send to discover other devices and their addresses. When a device sends a Who-Is message, all other compatible devices on the network respond with an I-Am message, which provides their device instance number, IP address, and other information.
The structure and contents of a Who-Is message are illustrated below.
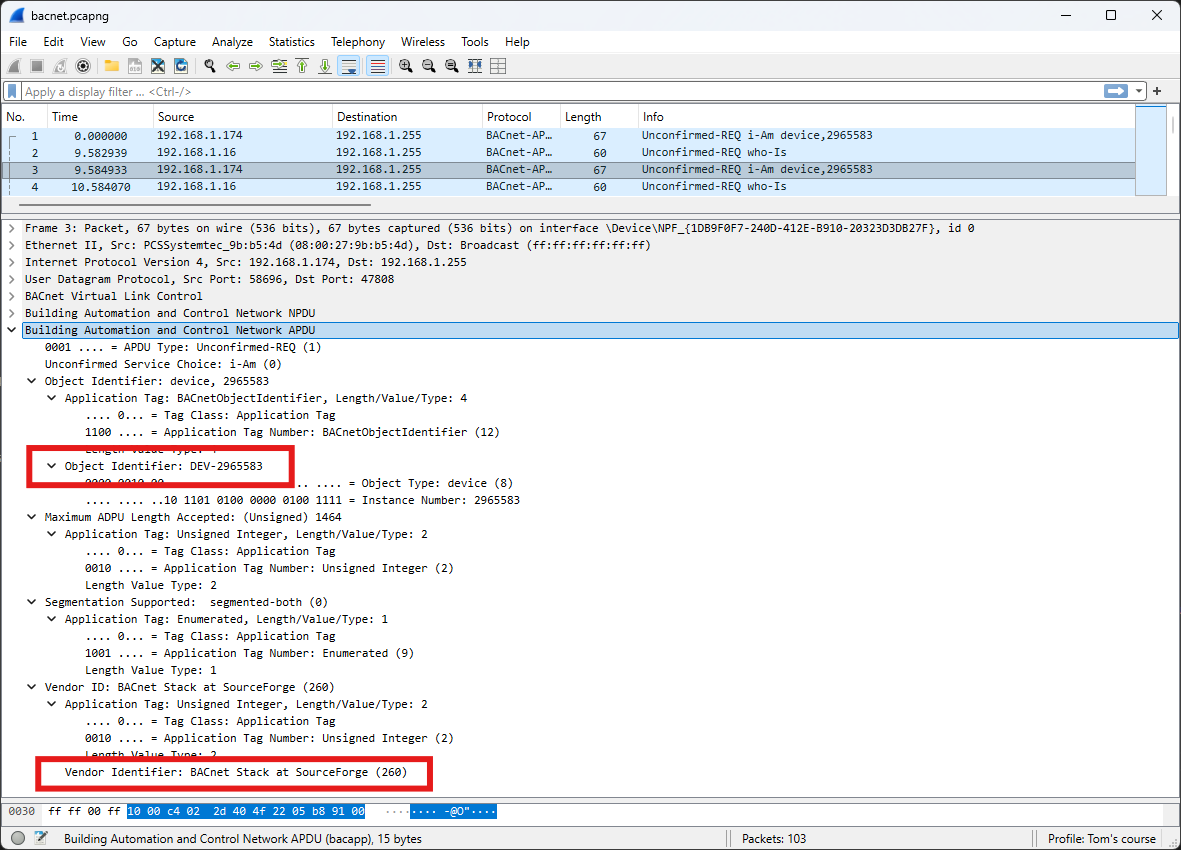
The structure and contents of a I-Am message are illustrated below.
Beginning with frame 8, Wireshark no longer identifies the network traffic as BACnet. This issue can be easily resolved by following the steps below. The default BACnet port number is 47808, which operates over the UDP protocol.
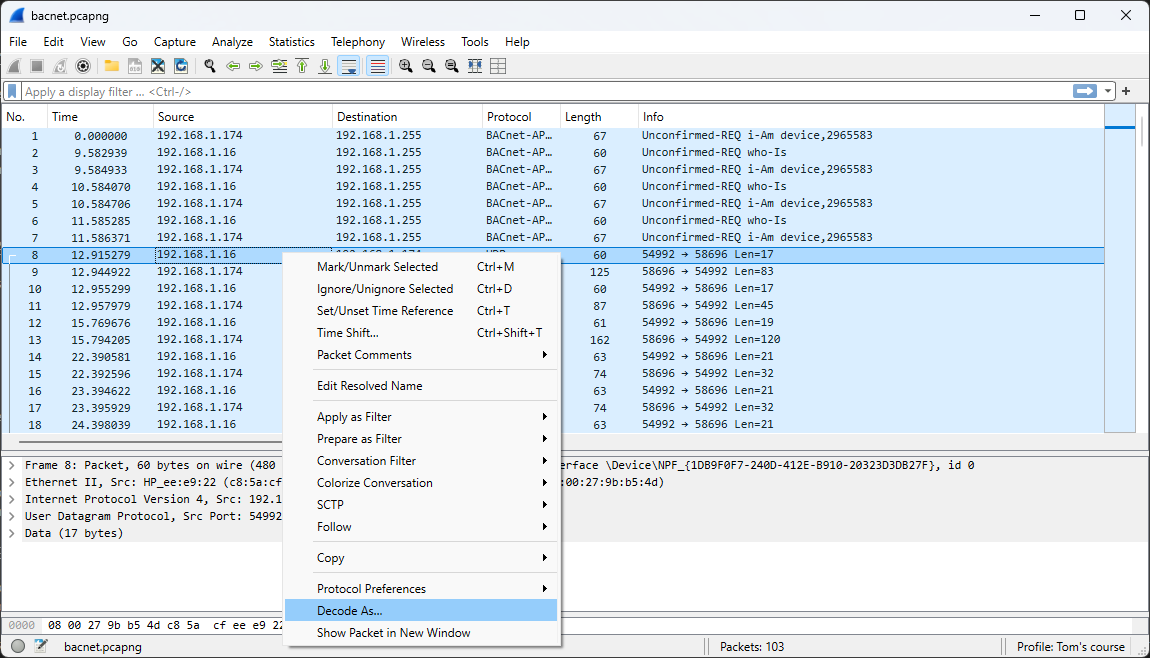
Select BVLC (BACnet Virtual Link Control)
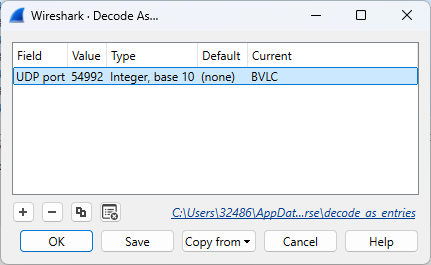
The desired outcome is now achieved, with all frames correctly identified as BACnet traffic.
Question:
Can you retrieve the temperature recorded on October 14, 2025, at 13:44:04 UTC?
# 8 Wireless LAN
Capturing wireless network traffic is not straightforward, which is why it is often considered a last resort. If a user experiences an issue on the wireless network, the first question to ask is whether the same issue also occurs on the wired network. This approach helps avoid the complexity of a wireless capture. Another practical alternative is to capture traffic directly behind the access point. This method has proven to be a valid substitute, since wireless traffic ultimately traverses the wired network at some point.
Capturing WLAN traffic requires specialized hardware support, correct setup (monitor mode, channel selection), and often cryptographic material (keys/handshakes). That’s why it’s not as straightforward as plugging into a switch for wired Ethernet.
A standard WLAN adapter normally only processes frames destined for it. To capture all wireless frames, the adapter must support monitor mode. Not all hardware or drivers allow this, especially on Windows.
WLAN also operates on multiple channels (2.4 GHz, 5 GHz, 6 GHz). An adapter can usually listen to only one channel at a time, so you may miss traffic unless you channel-hop or use multiple adapters.
Wireless signals degrade with distance, obstacles, and interference. You may not capture all packets if your capture device has poor reception.
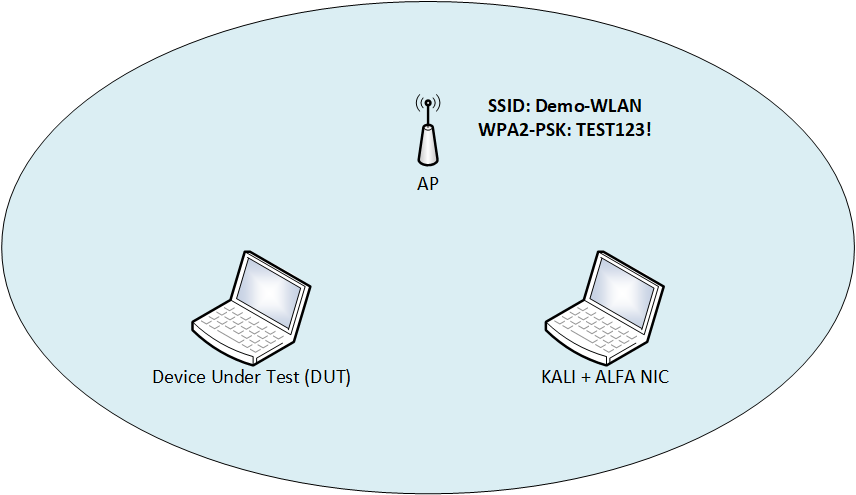
For this purpose, a dedicated configuration is used to capture WLAN traffic.
- KALI Linux as operating system
- ALFA AWUS036NHA as the network adapter (Seen as Qualcomm Atheros AR9271 801.11n)
8.1 Capture, analyze and decrypt wireless traffic
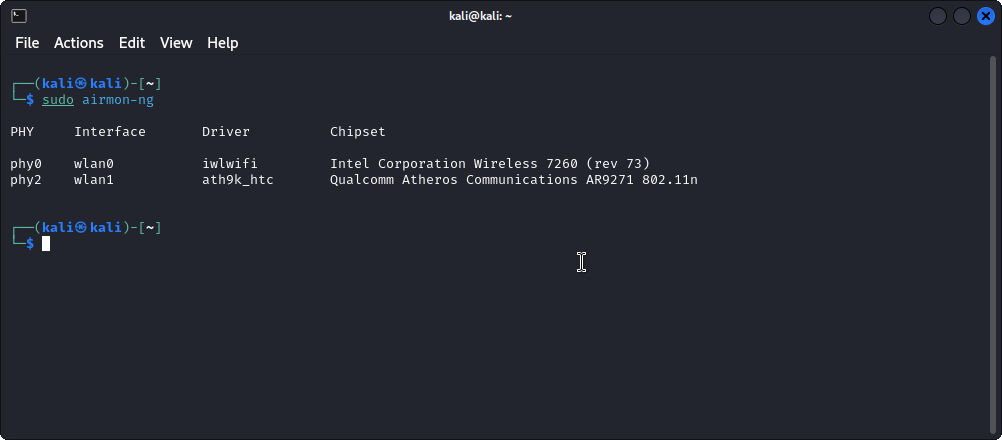
- Step 1: Run the command
sudo airmon-ngto display the list of available adapters.
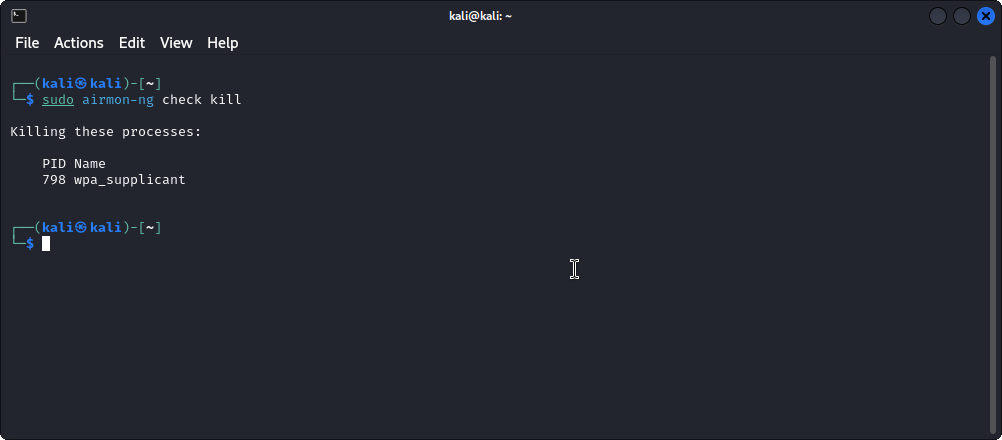
- Step 2: Enter the command
sudo airmon-ng check killto avoid interference with other tools.
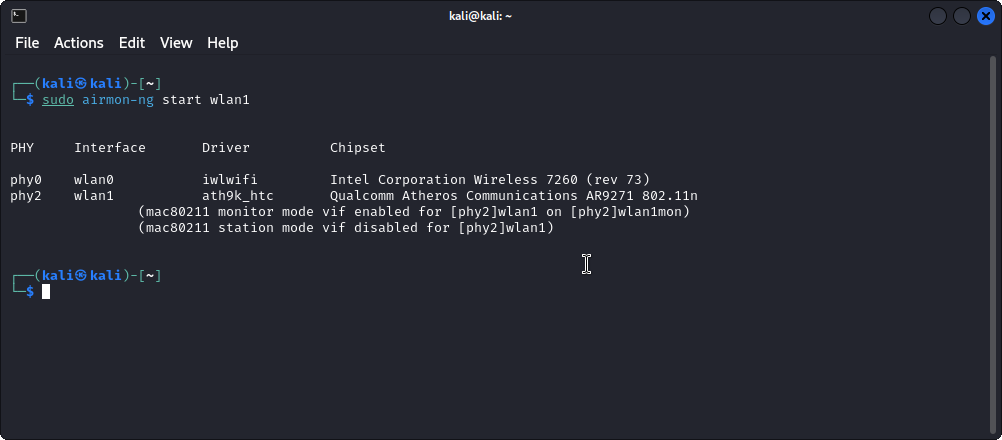
- Step 3: Execute the command
sudo airmon-ng start wlan1to put the adapter in monitor mode.
- Step 4: Use the command
sudo airodump-ng wlan1monto scan for WLAN networks.
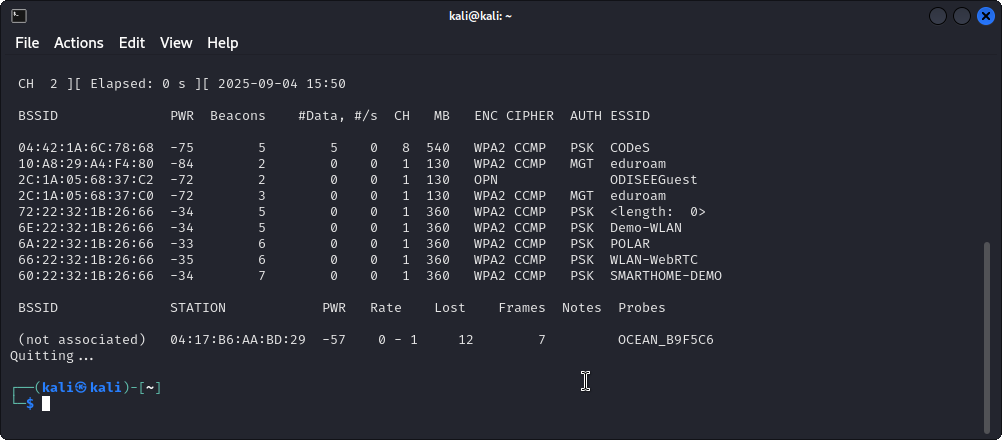
Our focus is on the wireless network identified as Demo-WLAN, which operates on channel 1.
- Step 5: Run the command
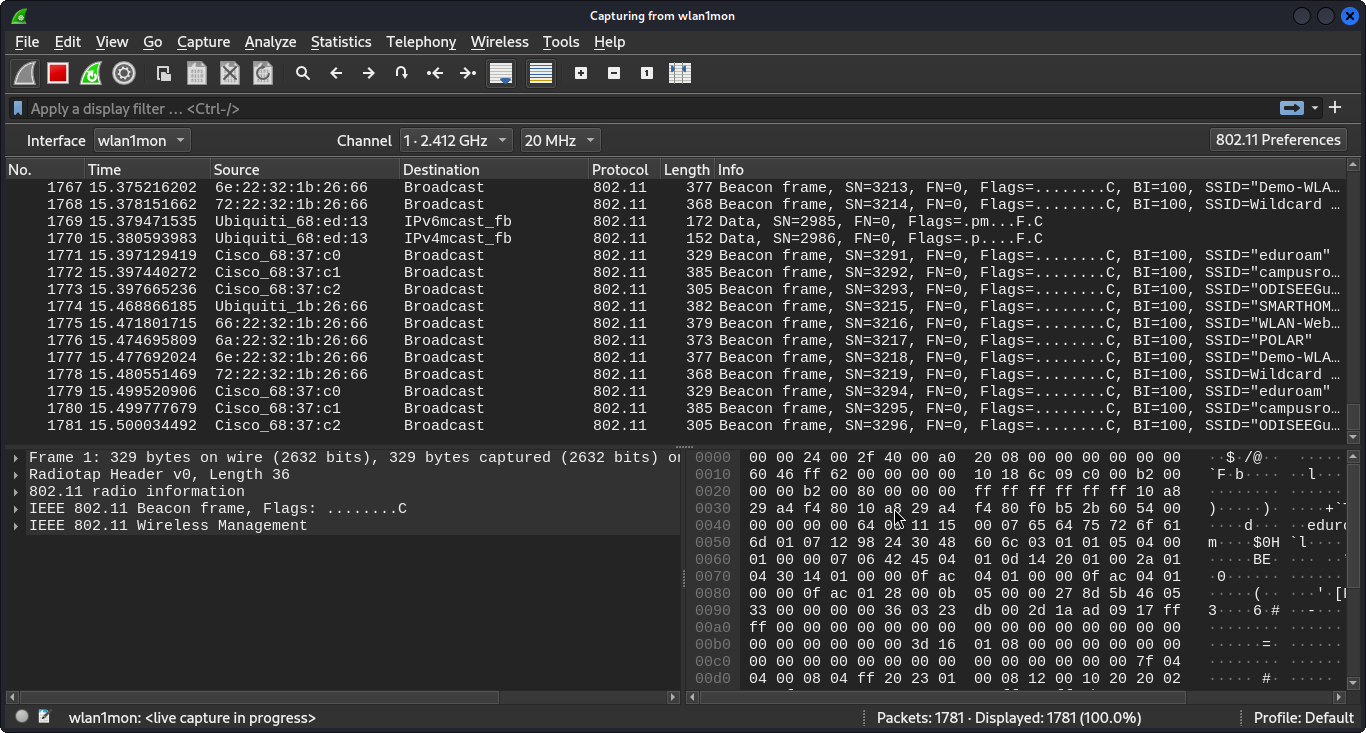
sudo wiresharkto start Wireshark and add theWireless toolbarvia theViewmenu. Change the channel to 1 and double-click on the interfacewlan1mon.
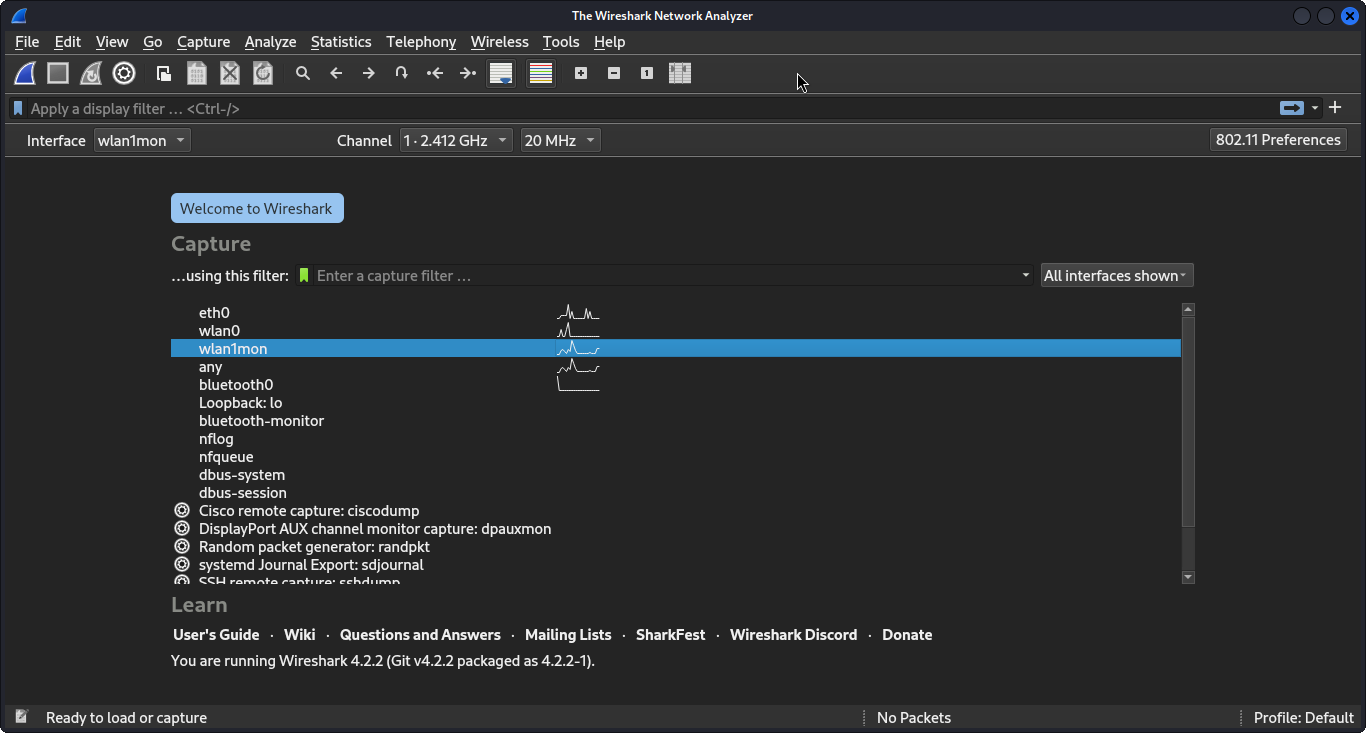
- Step 6: The captured frames are displayed. This visualization is not ideal since multiple SSIDs are visible, while we are only interested in Demo-WLAN.
- Step 7: A simpler and more efficient approach is to use the command
sudo airodump-ng --bssid 66:22:32:1B:26:66 -c 1 -w ./Desktop/our_capture wlan1mon.
This causes us to capture only the frames that belong to the wireless network Demo-WLAN. We can then further analyze our capture with Wireshark.
This is therefore a typical example where Wireshark is not used for capturing but only for analyzing network traffic.
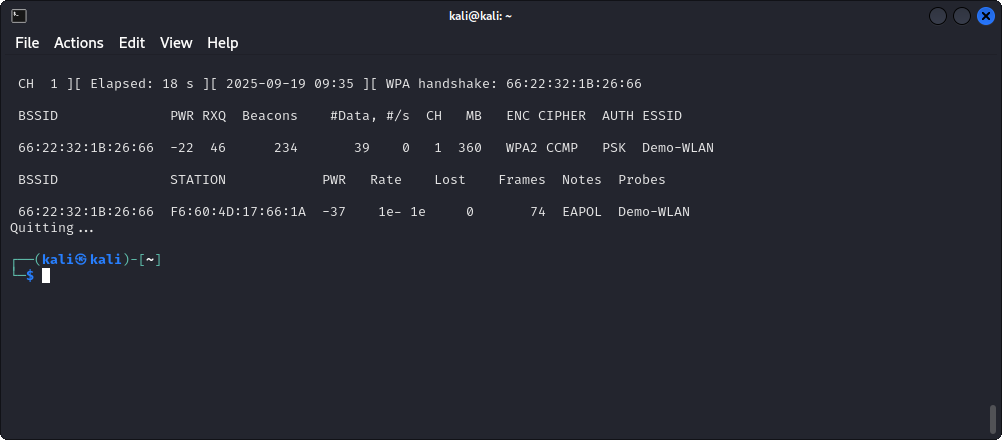
It is very important to know that encrypted wireless network traffic can only be decrypted if the handshake can be captured. (See the top left of the figure above.)
The handshake can be obtained easily by connecting an additional device to the target network or by triggering a deauthentication attack on an already connected device.
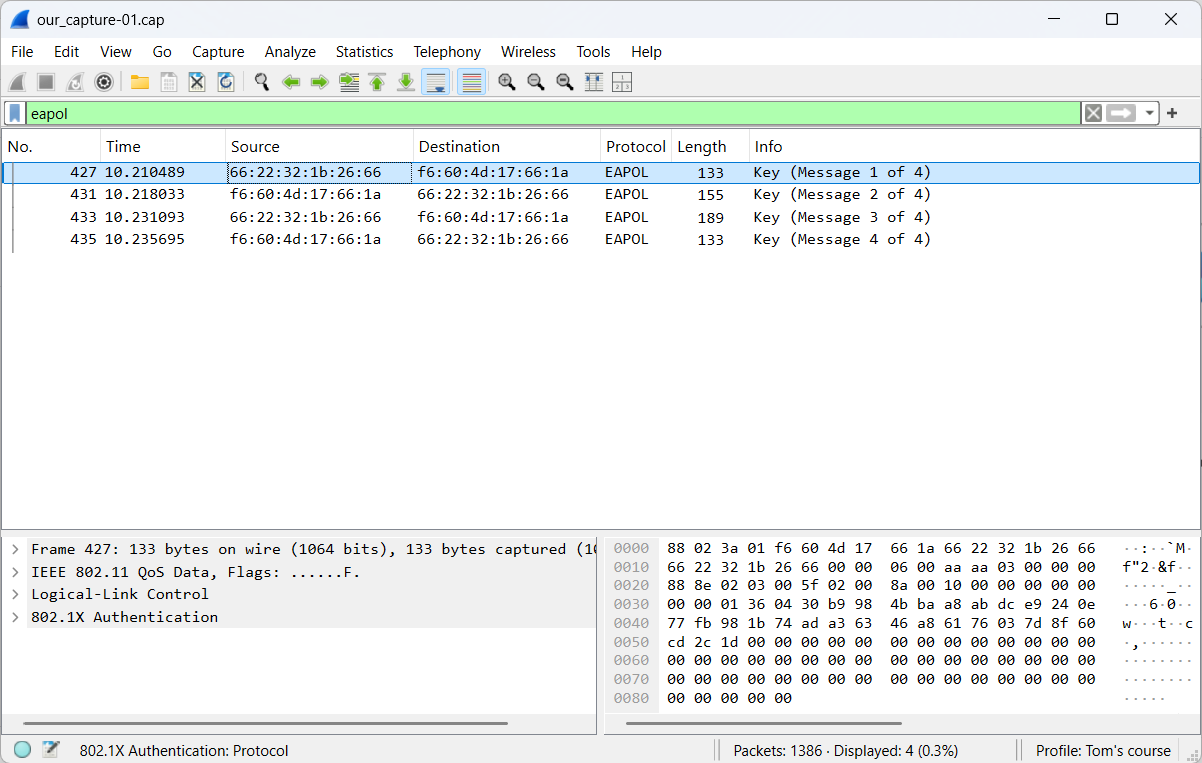
The handshake can also be visualized in Wireshark using the display filter eapol.
- Step 8: Below you will find the settings to decrypt the captured wireless network traffic.
Select
Edit→Preferences→Protocols→IEEE 802.11→Decryption keys Edit
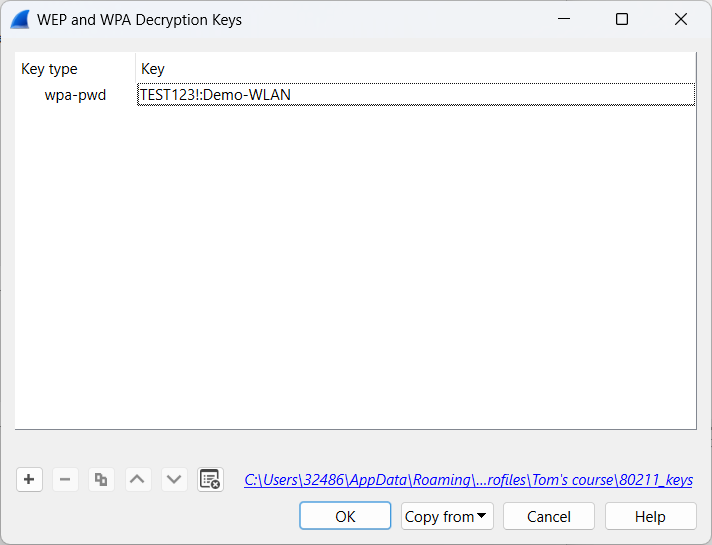
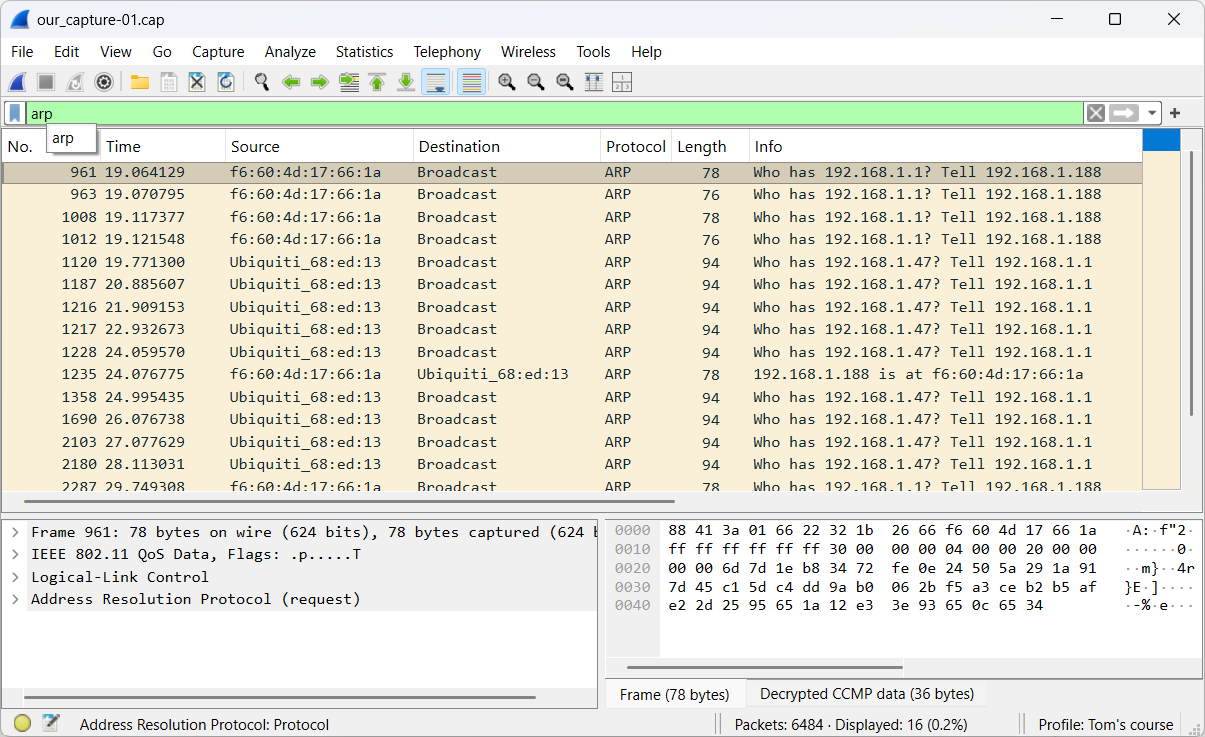
- Step 9: After a successful decryption, we can clearly visualize different protocols, such as ARP.
# 9 Universal Serial Bus (USB)
USB traffic works through a host-controlled, packet-based system where the host initiates all communication. When a device is plugged in, the host runs an enumeration process to identify the device and its capabilities. After enumeration, data is sent in packets, with the host requesting data from a device and the device sending it back in response. This process relies on defined data transfer types like bulk, interrupt, and isochronous, and is managed by rules for error handling and power management.
9.1 Installing USBPcap
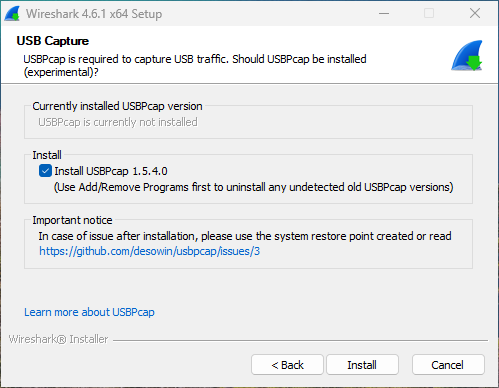
To capture USB traffic with Wireshark, you must first install an additional tool specific to your operating system: USBPcap (opens new window).
By checking the "Install USBPcap" box in the Wireshark installer, you add the necessary driver and files to your system, allowing Wireshark to list and capture data from USB devices.
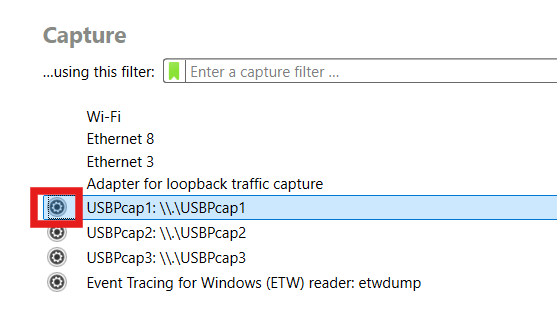
9.2 Using USBPcap
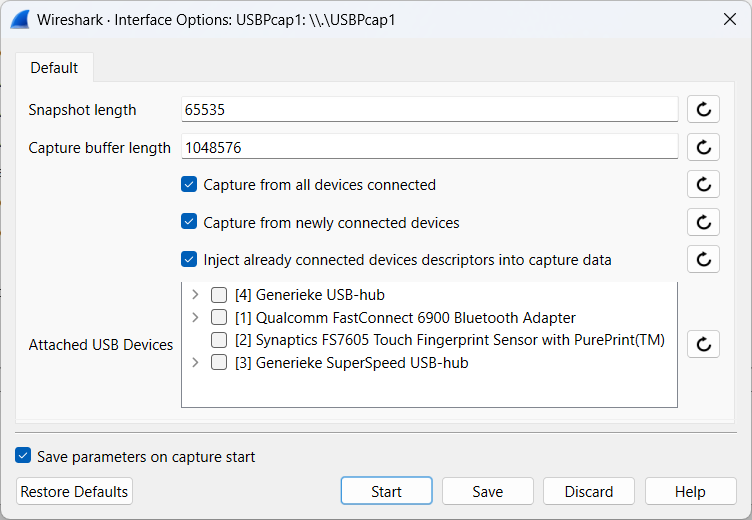
After installing USBPcap, start Wireshark. You will see multiple USBPcap interfaces. You need to determine which interface your USB device (the device under test) is connected to. For example, I connected an additional keyboard to my laptop.
- Before connecting the additional keyboard
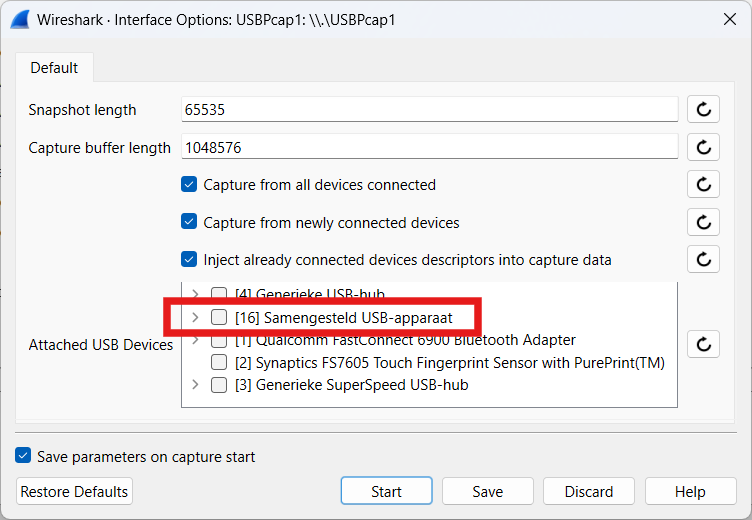
- After connecting the additional keyboard
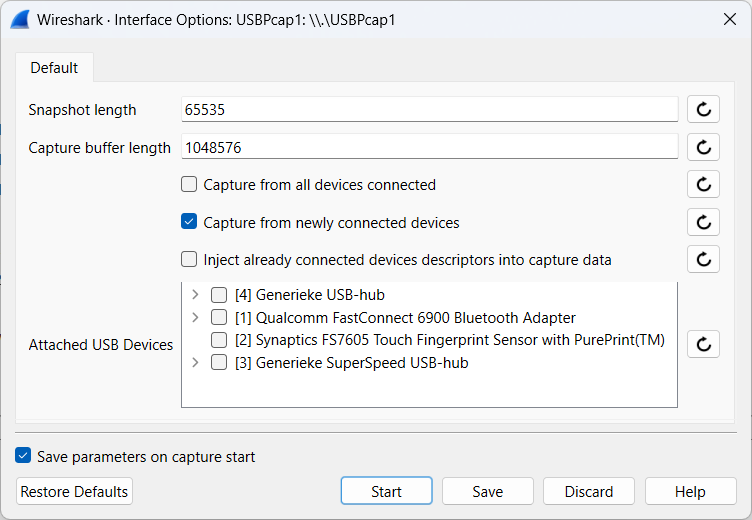
Disconnect the additional keyboard before starting the capture, and select “Capture from newly connected devices” only.
Start the capture, connect the external keyboard, press a few keys, and then stop the capture.
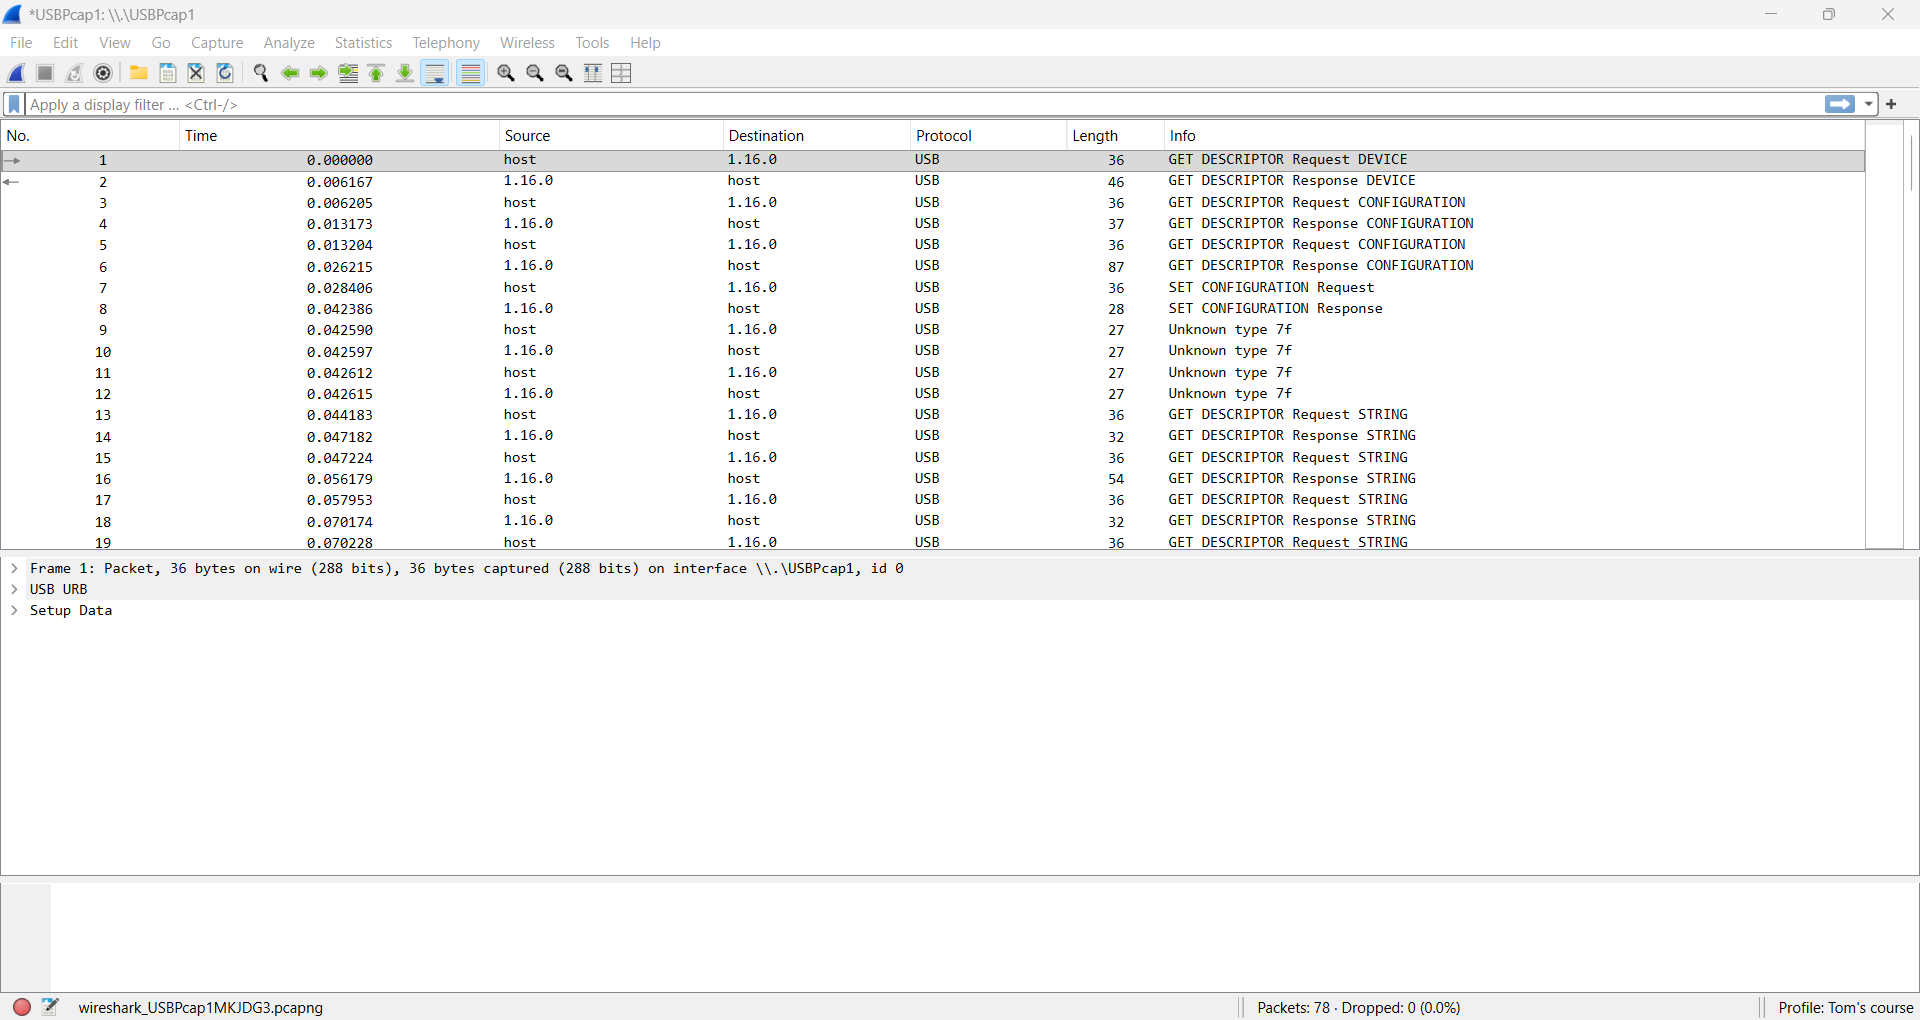
Apply a display filter to identify the keystrokes.((usb.transfer_type == 0x01) && (usb.src == "1.16.1")) && !(usbhid.data.array == 00:00:00:00:00:00) Our focus is limited to incoming interrupt packets originating from the keyboard that contain a non-zero data field.
By examining the HID data, we can identify the keystrokes.
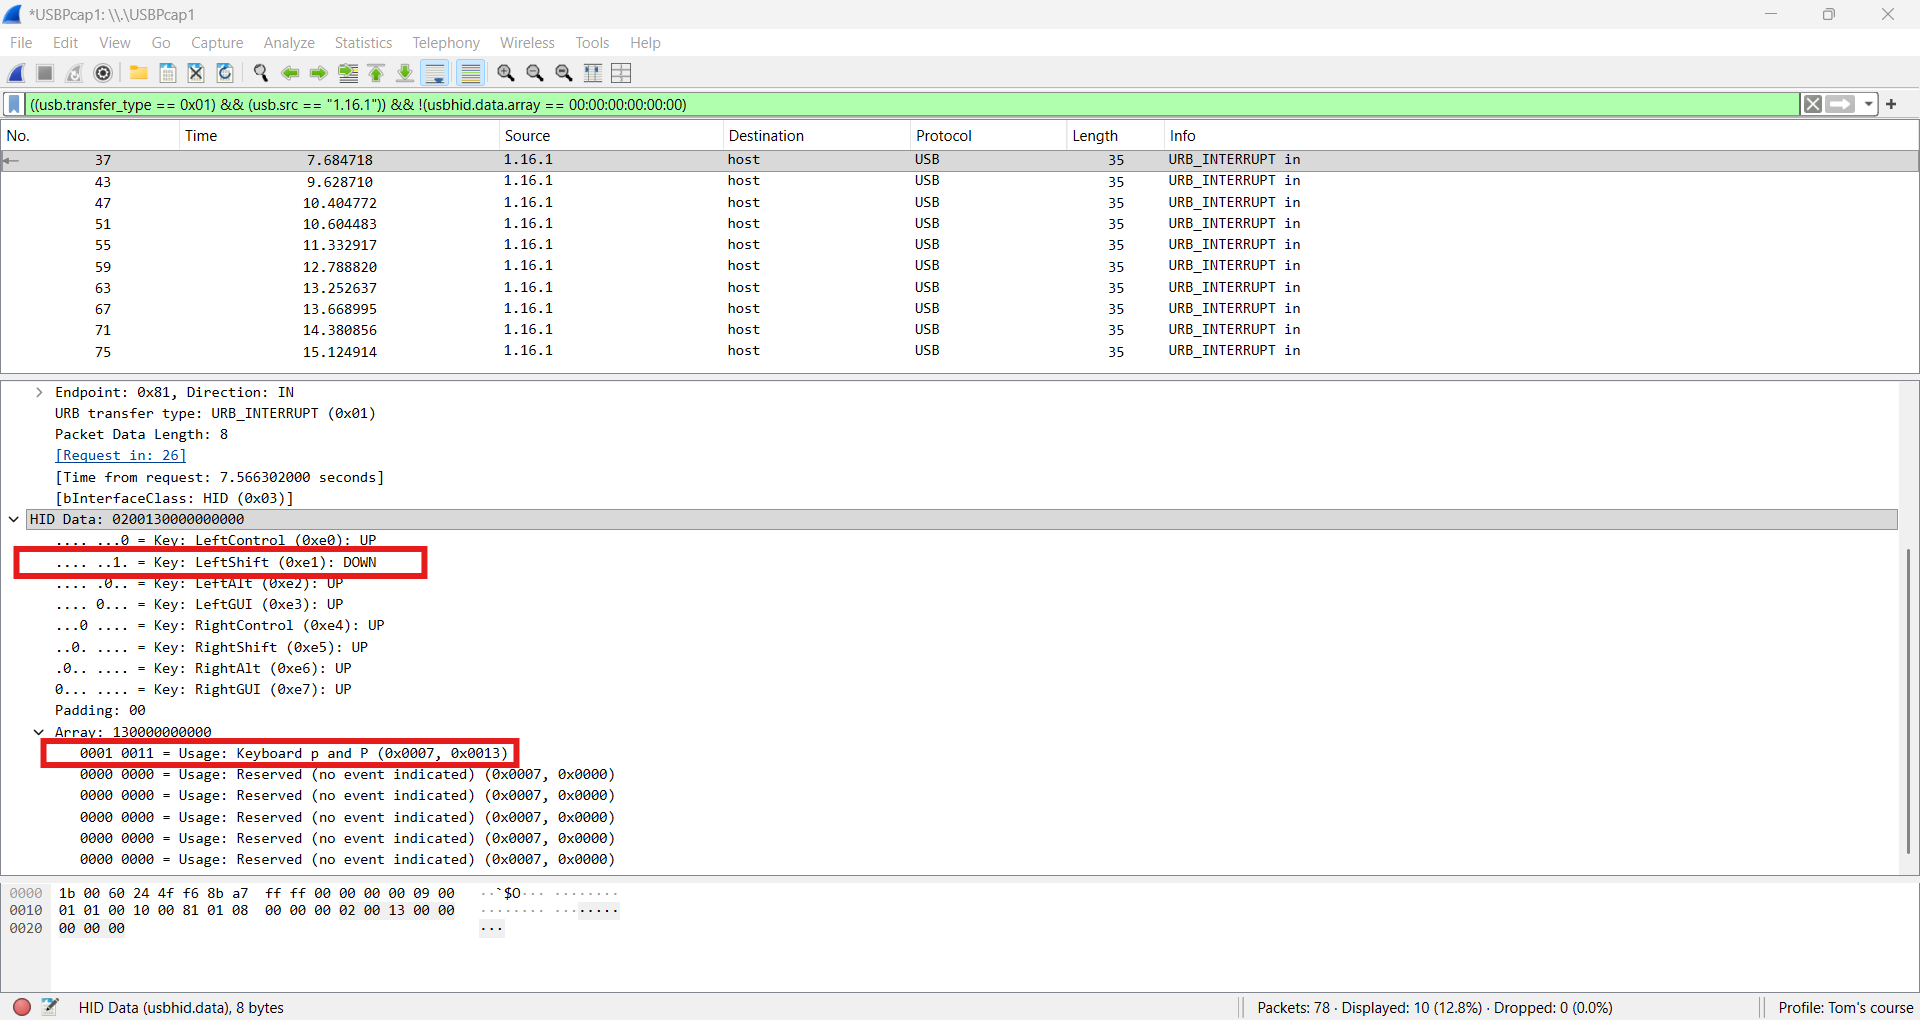
Question:
Can you determine which word the user typed? Note: The user was using a Belgian (Dutch) keyboard layout.
File to be used: usb-keyboard.pcapng (opens new window)
# 10 Nice to know
10.1 Add notes to a PCAPng file
Comprehensive documentation is of paramount importance, as it serves as the foundation for effective troubleshooting. Annotations may be applied to PCAPpng files, whereas PCAP files do not support this feature.
An exercise will be used to help clarify certain concepts.
The following file will be used: notes.pcapng (opens new window)
- General comments
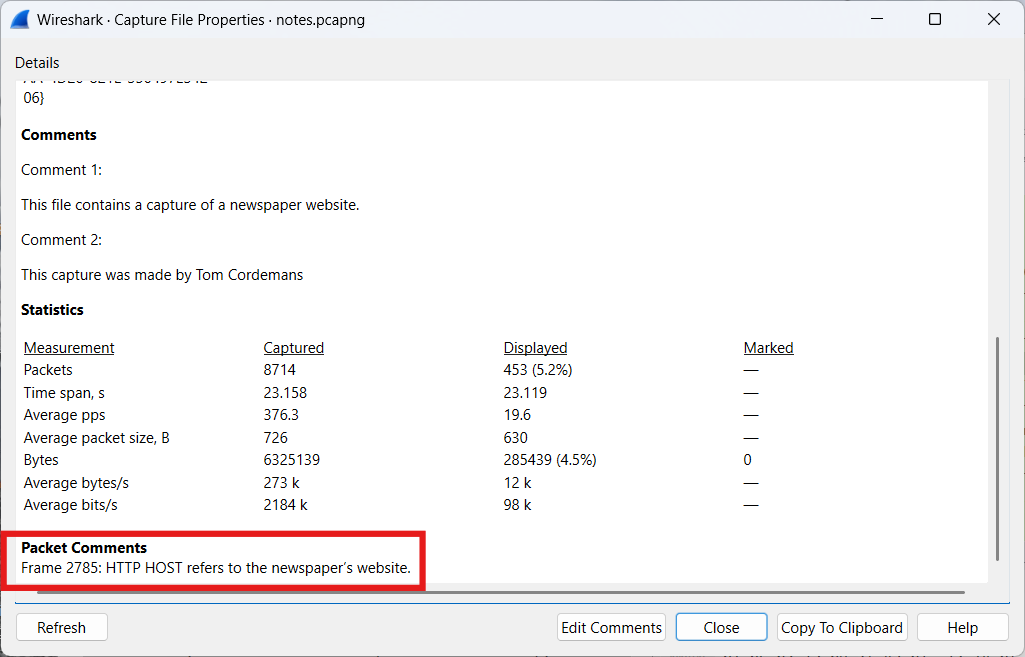
General comments can be appended to a PCAPng file via Edit Comments within the Capture File Properties.
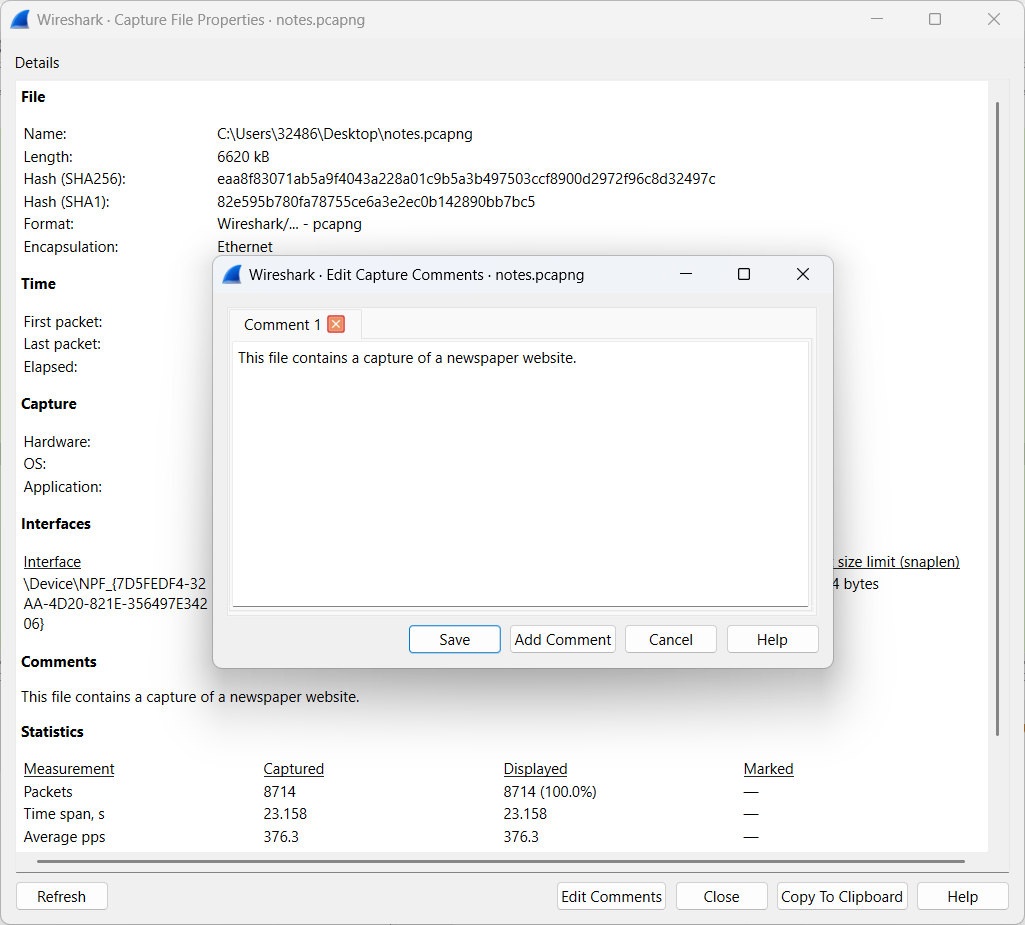
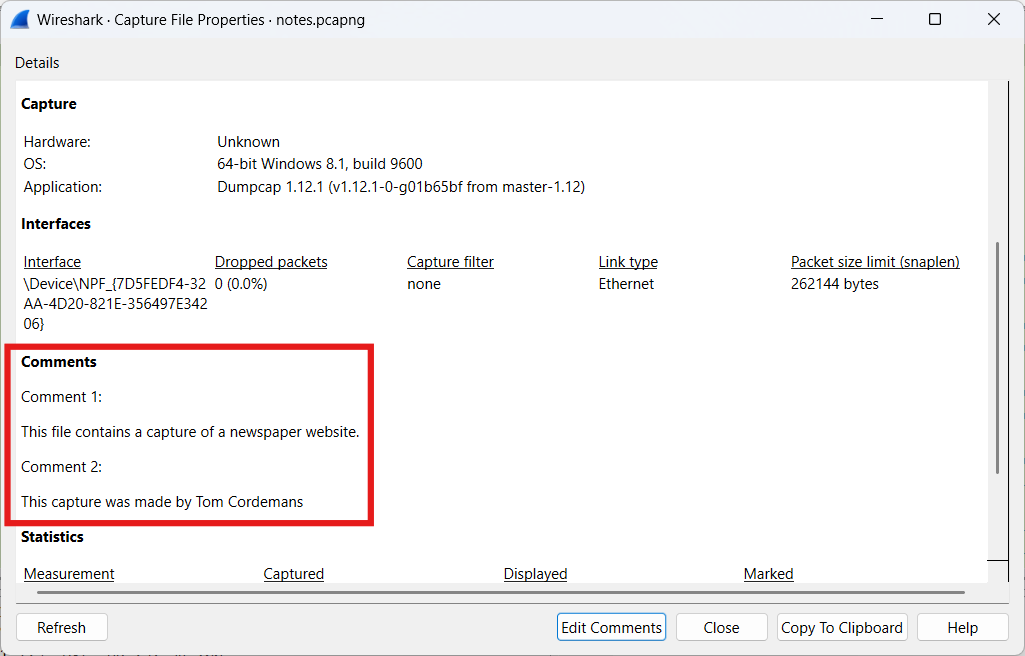
Multiple general comments can be added to a PCAPng file. These notes are consistently displayed in the Capture File Properties.
- Packet comments
It is also possible to annotate specific packets with additional information.
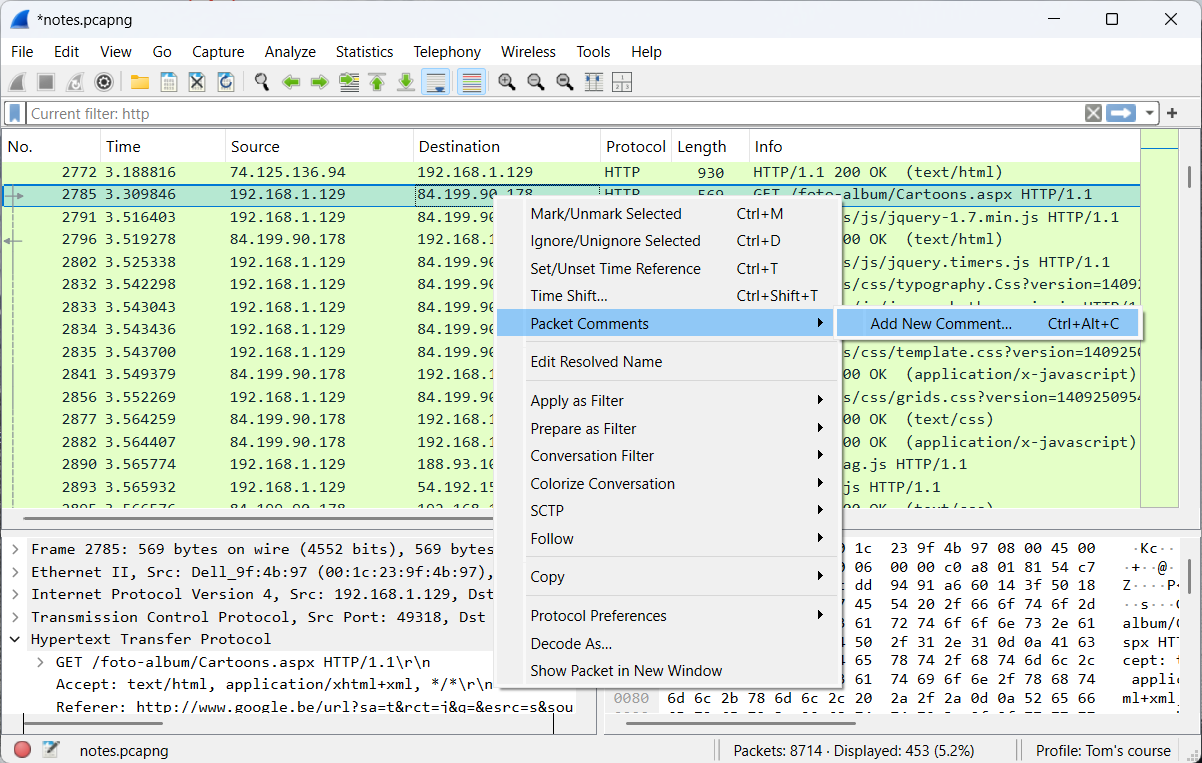
This information can later be easily retrieved in various ways.
- Via the Packet Details Pane
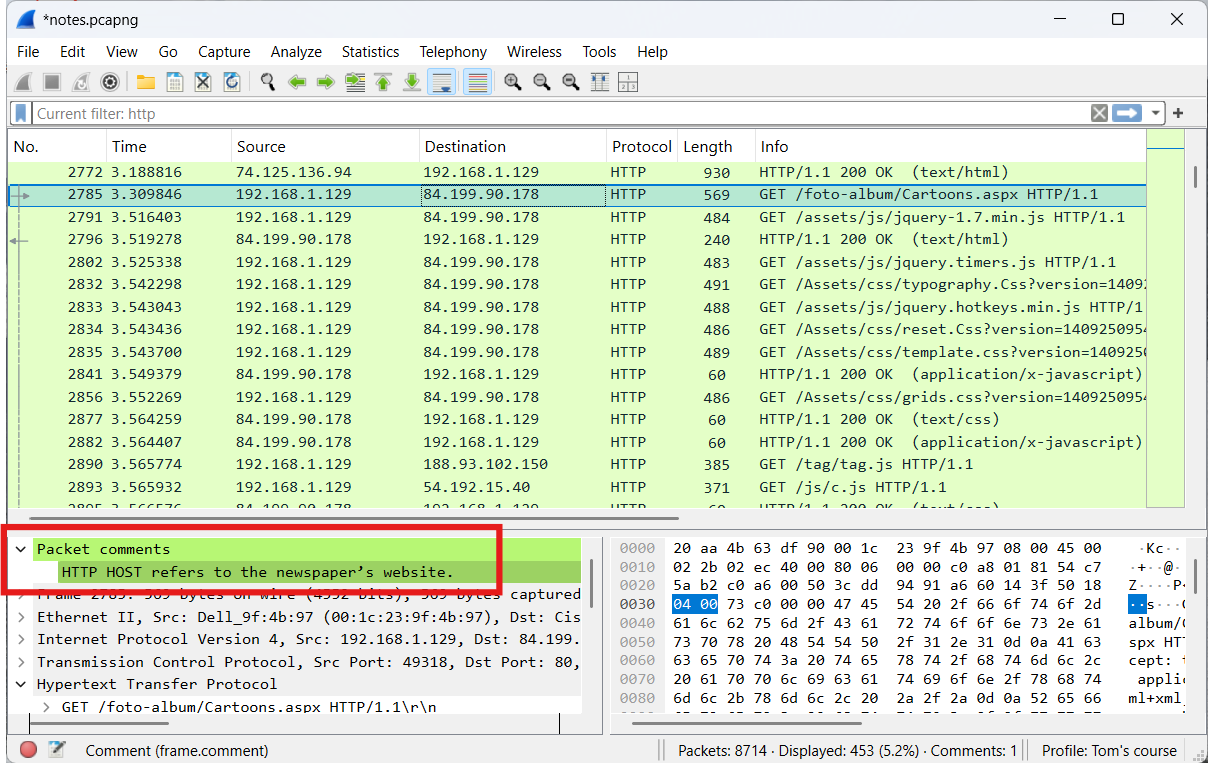
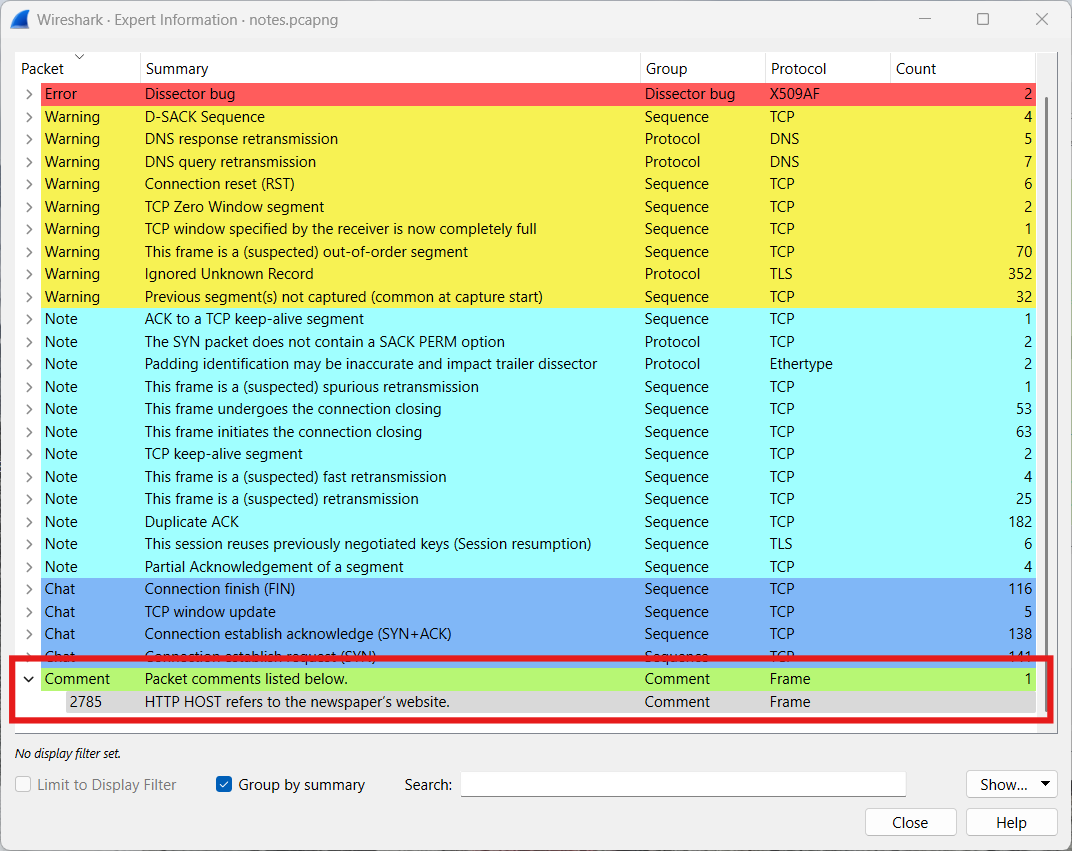
- Via the Expert Information
- Via the Capture File Properties
10.2 Command line tools
By default, a Wireshark installation includes several command line tools. Below is an overview of some commonly used tools.
- Editcap: Converts capture files in various ways.
- Capinfos: Prints information about capture files.
- Mergecap: Combines multiple capture files into a single file.
- Dumpcap: Captures network traffic.
- Tshark: Captures and analyzes network traffic.
More tools and extra information can be found here (opens new window).
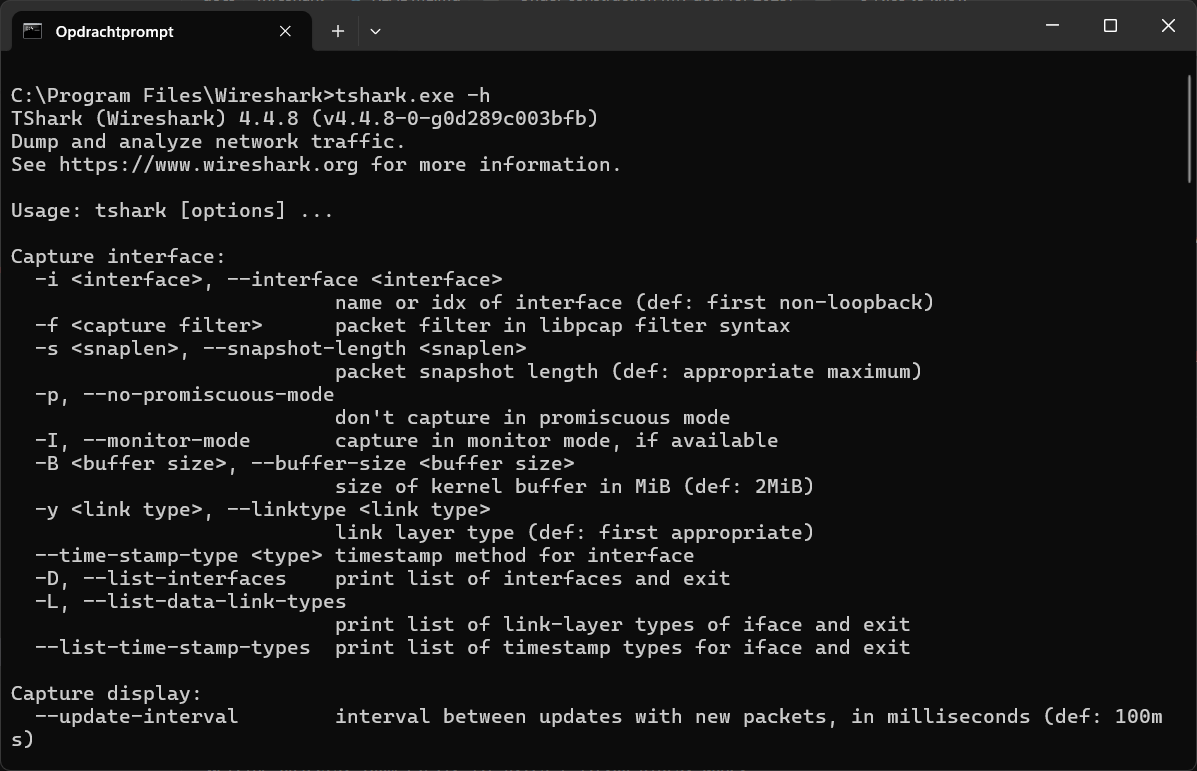
This section provides a brief study of Tshark’s basic operations.
An overview of all options can be obtained using the command tshark.exe -h.
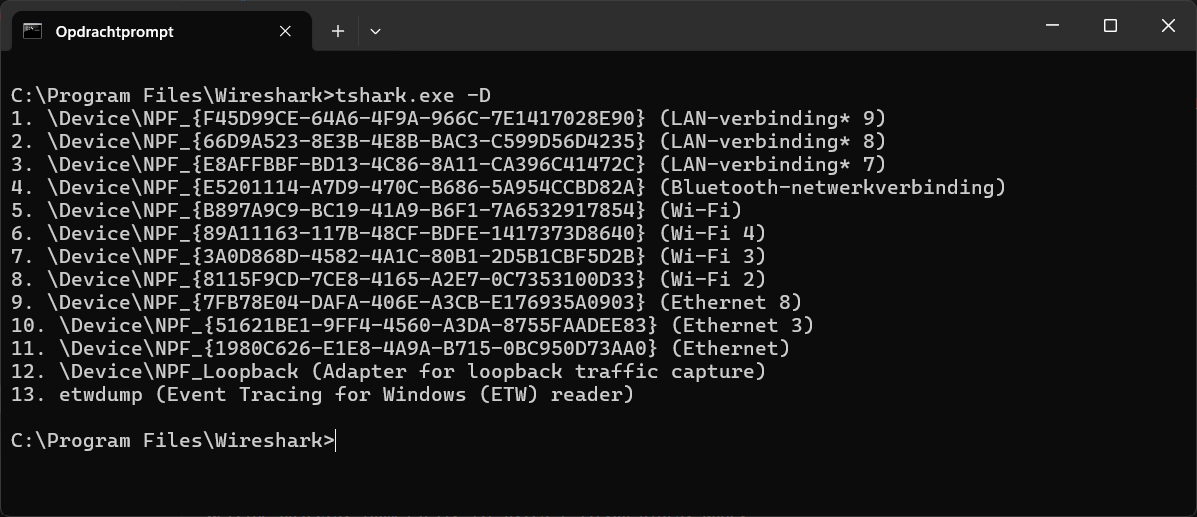
An overview of all available interfaces can be obtained using the command tshark.exe -D.
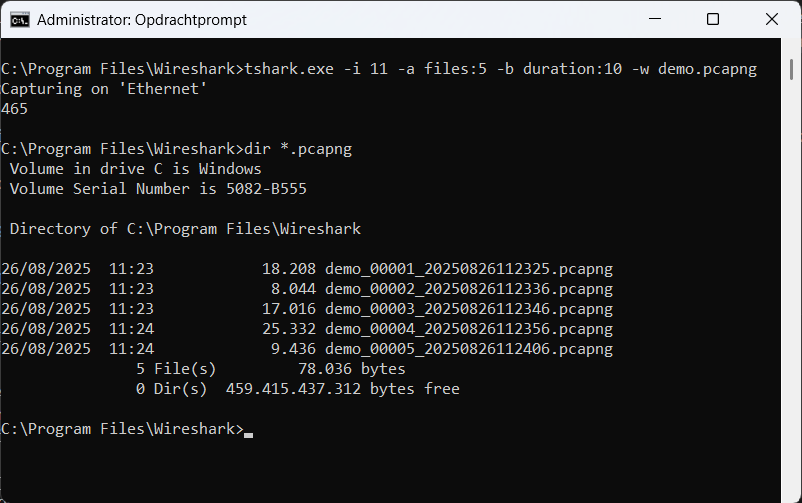
Capture traffic on the Ethernet interface, automatically stopping after 5 files, and create a new file every 10 seconds using ‘demo.pcapng’ as the base name. This is done using the following command: tshark.exe -i 11 -a files:5 -b duration:10 -w demo.pcapng.
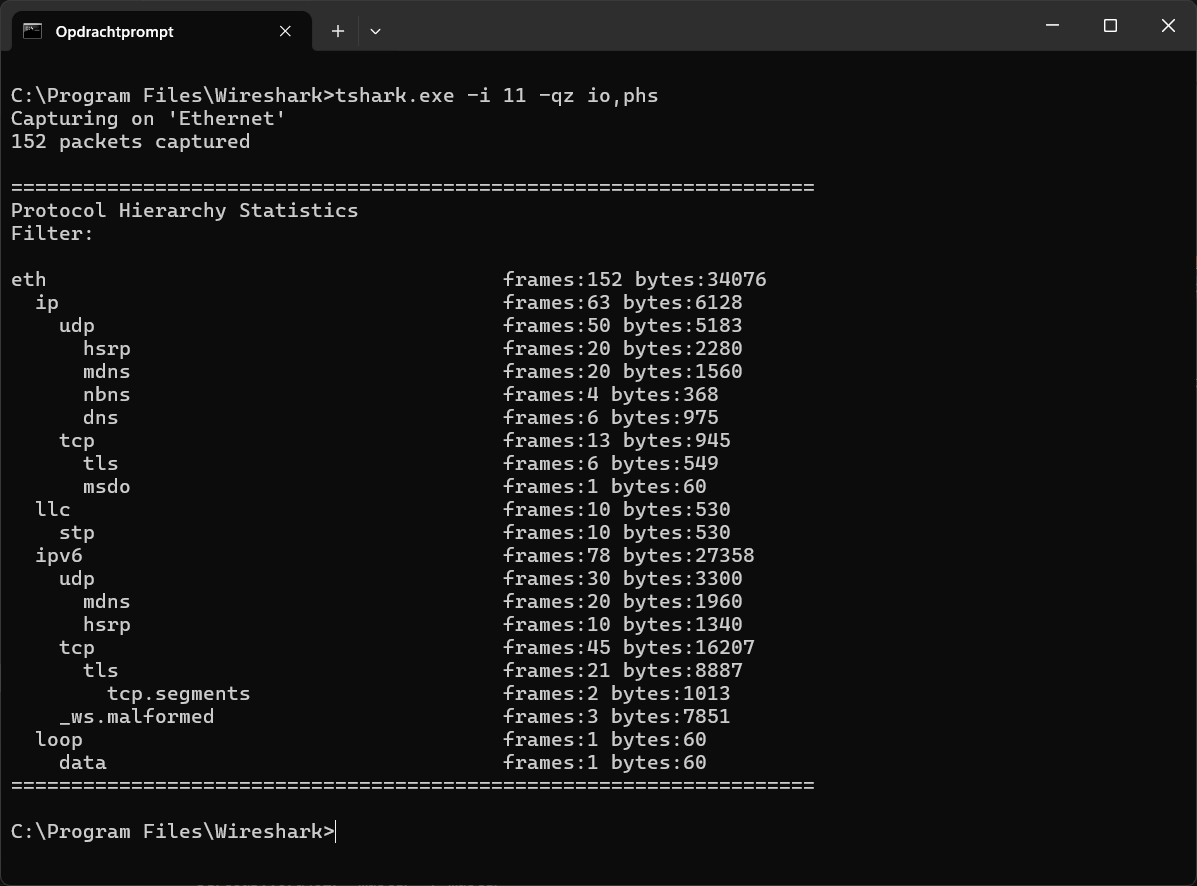
A quick analysis of network traffic can be obtained using the following command: tshark.exe -i 11 -qz io,phs .
10.3 Lua plugins
Lua plugins in Wireshark are scripts written in the Lua programming language that extend Wireshark’s functionality.
They are commonly used to:
- Create custom protocol dissectors (to decode proprietary or unsupported protocols)
- Add new analysis features or filters
- Automate tasks within packet analysis
Lua plugins load without recompiling Wireshark, making them a flexible way to customize how network traffic is analyzed and displayed.
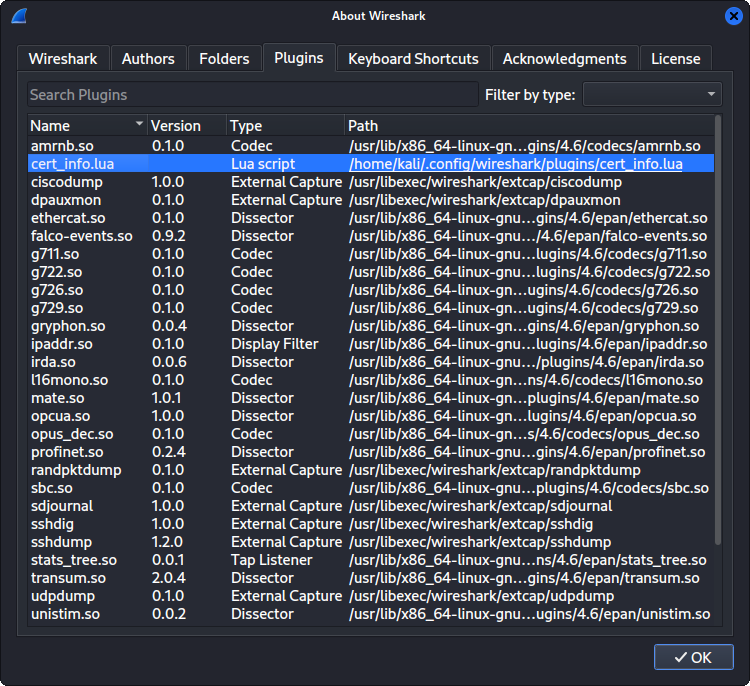
A screenshot of a Lua script is shown below.
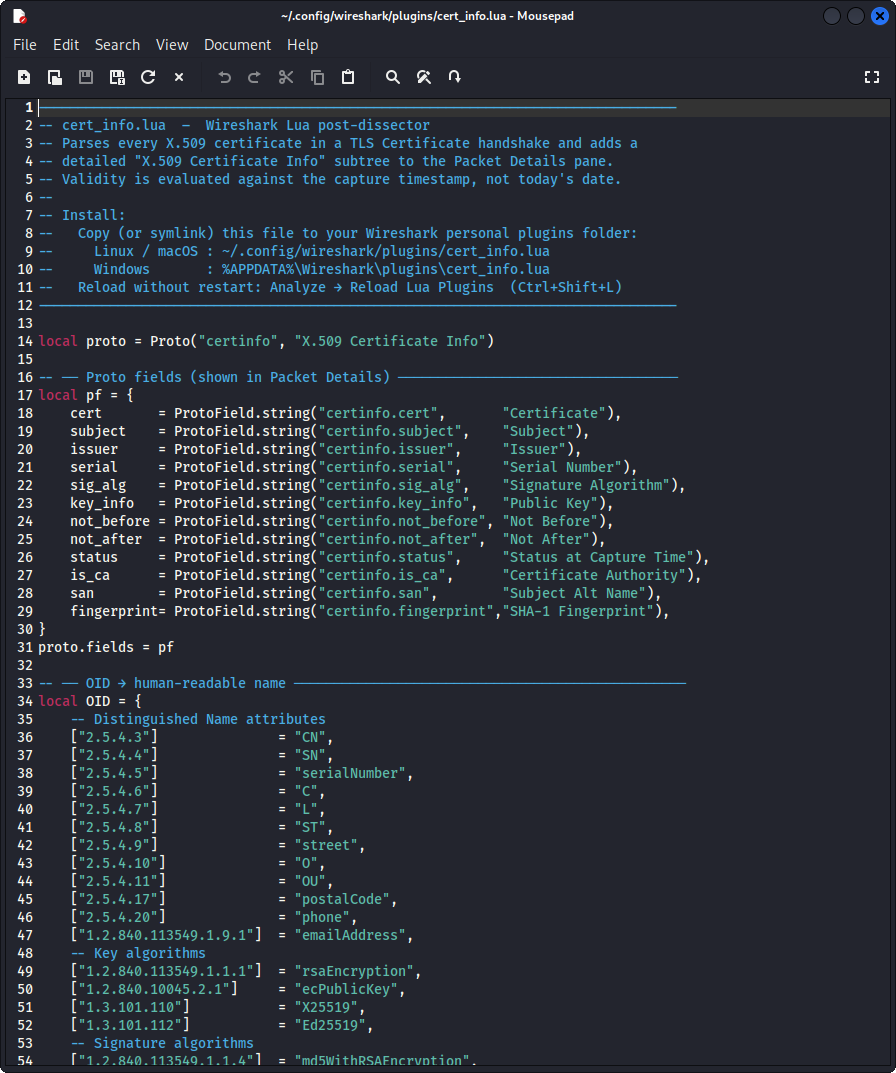
Below you will find the Lua script used in this example.
cert_info.lua (opens new window)
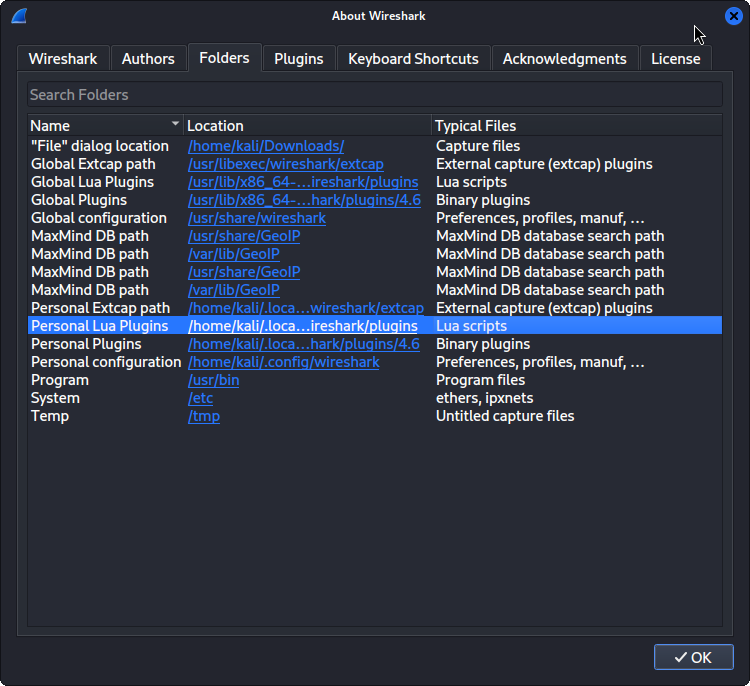
Place the Lua script in the appropriate folder. The folder locations can be found via Help → About Wireshark → Folders.
Once the file is placed correctly and Wireshark has been restarted, you will be able to use the additional functionality described in the LUA script.
# 11 Other sources
Wireshark documentation (opens new window)
Wireshark wiki (opens new window)
# 12 Answers
1.3. First exploration
- How many packets does this PCPAng file contain?
3200 - What IP addresses made a TCP connection in frames 18, 21, and 22?
192.168.1.129 and 195.238.0.64 - What HTTP command was sent by the client in frame 23?
GET - What response was sent by the HTTP server in frame 29?
Status Code 302 - What is the length of the largest frame in this PCAPng file?
1514 bytes - What protocols are visible in the protocol column?
DNS, HTTP, IGMPv2, TCP and TLSv1 - What web browser was used by the client?
Internet Explorer 11 (User-Agent: Mozilla/5.0 (Windows NT 6.3; WOW64; Trident/7.0; rv:11.0) like Gecko)
2.5 Hands-on exercise
- Identify the most likely cause of the issue.
E) The web server operates on a non-standard port
4.2 Display filter practice
- Part 1
How can we detect these types of connections?
Use the display filtertcp.flags == 0x0002 && ip.dst == 192.168.1.129 - Part 2
In what ways can delays within a conversation be detected?
Add an extra columntcp.time_deltaand use the display filtertcp.time_delta > 1
6.3 Extract images out of a stream
- How many JPEG files can be extracted?
29
6.4 Extract video out of a stream
- Which message is displayed in the video stream?
FLAG {BIG-BROTHER}
7.1 Decryption of TLS sessions
- Among the hidden messages are
Sniffing the glue that holds the Internet together.andIt's a great product with a great story to tell. I'm pumped!
7.2 The Value of baselining
- What is the likely cause?
The usual approach is to compare the current capture with a baseline to spot anomalies. In error1.pcpang we observe traffic on a switch port that should not occur, such as communication between 172.20.0.2 and 17.20.0.1. This indicates the switch’s function is bypassed, possibly due to a MITM attack.
7.3 OT (Operational Technology) networks
7.3.1 PROFINET
- What is the current speed at frame 4619?
The value 0x2002 corresponds to approximately 50% of the maximum speed. Therefore, the current speed is 200 rpm, while the motor remains in the ON state.
7.3.2 BACnet - Can you retrieve the temperature recorded on October 14, 2025, at 13:44:04 UTC?
20,80 °C
9.2 Using USBPcap
- Can you determine which word the user typed?
Password!
← Home CyberOps labs →